# SmartWAN Portal
This is a guide for users to use the security operating center portal of OpenSASE.
# Overview
[](https://book.weetizen.com/uploads/images/gallery/2025-04/1.jpg)
#### **SmartWAN Portal**
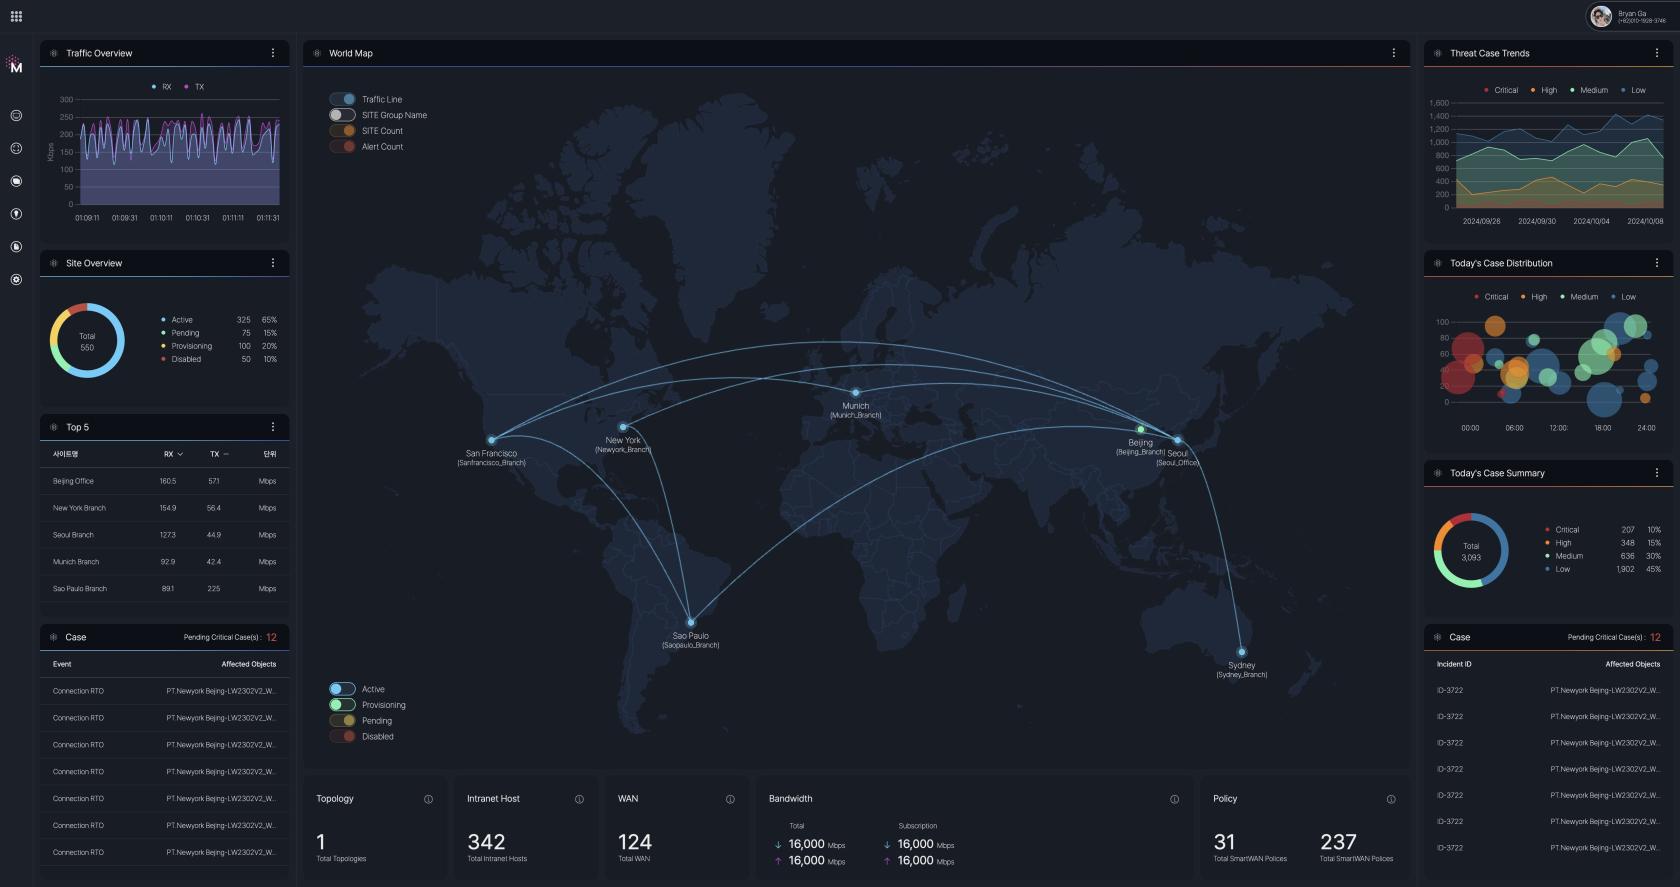
The SmartWAN Portal provides a centralized, real-time interface for comprehensive security monitoring and management across hybrid IT environments.
Designed to integrate on-premises and cloud-based security data, the dashboard offers a unified view of an organization’s security posture, enabling proactive threat detection, alert management, and streamlined compliance tracking.
The portal offers a variety of dashboards, including the **Agency Dashboard**, **Event Dashboard**, and **Threat Scoring Dashboard**, each tailored to specific monitoring needs. Upon accessing the SmartWAN Portal, users are directed to the default **Agency Dashboard**, which provides visualized status information on network and security events for agencies with installed SmartWAN Customer Premises Equipment (CPE). Additional features, such as user authentication, event lists, and detailed agency monitoring, empower users to manage incidents effectively and maintain operational security.
**SmartWAN Portal Login**
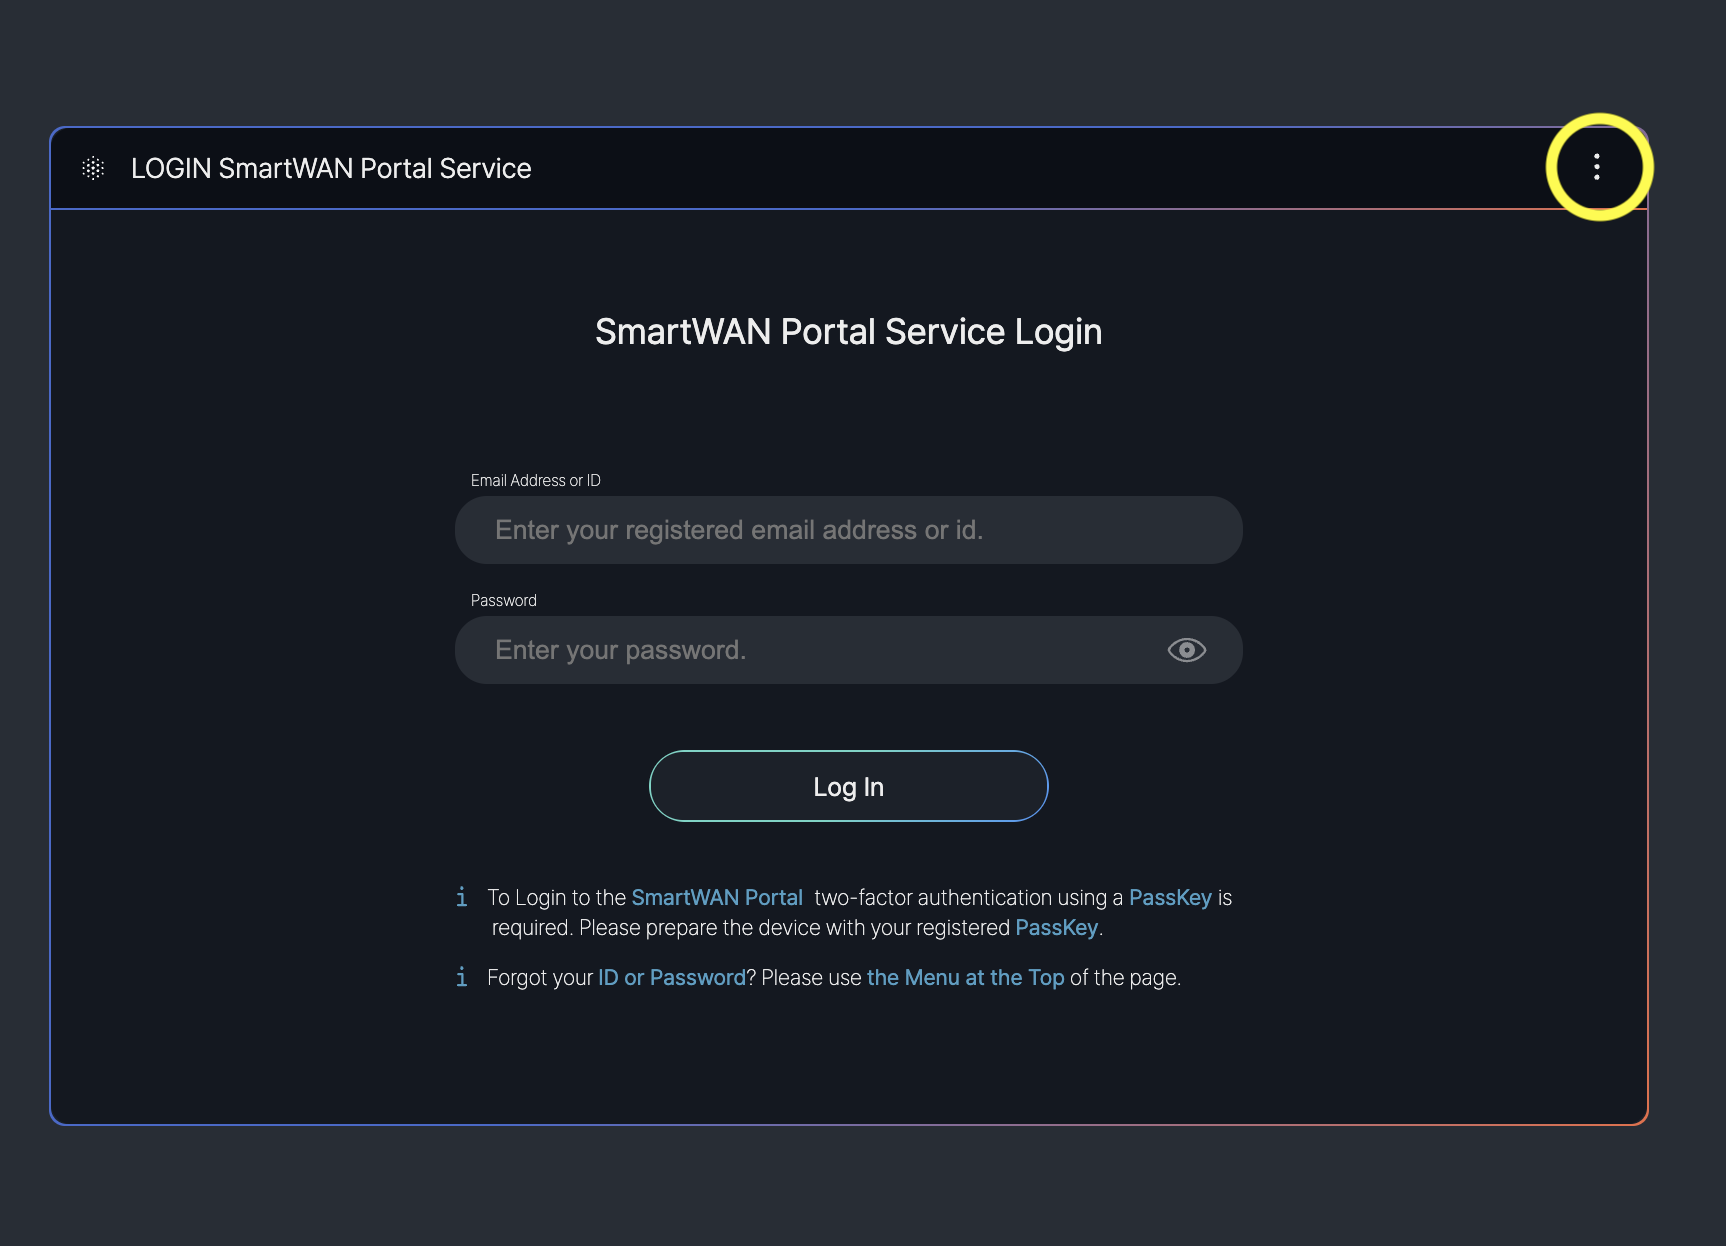
When you access the SmartWAN Portal, you will encounter the login screen as shown in the image below. This screen allows users to authenticate and access the portal's features.
[](https://book.weetizen.com/uploads/images/gallery/2025-04/raFimage.png)
**Input Fields**: - **Email Address or ID**: A field where users enter their registered email address or ID (e.g., "Enter your registered email address or ID").
- **Password**: A field for entering the user’s password (e.g., "Enter your password"), with a visibility toggle icon to show or hide the password.
**Additional Authentication Options**
- Top-right corner of the screen.
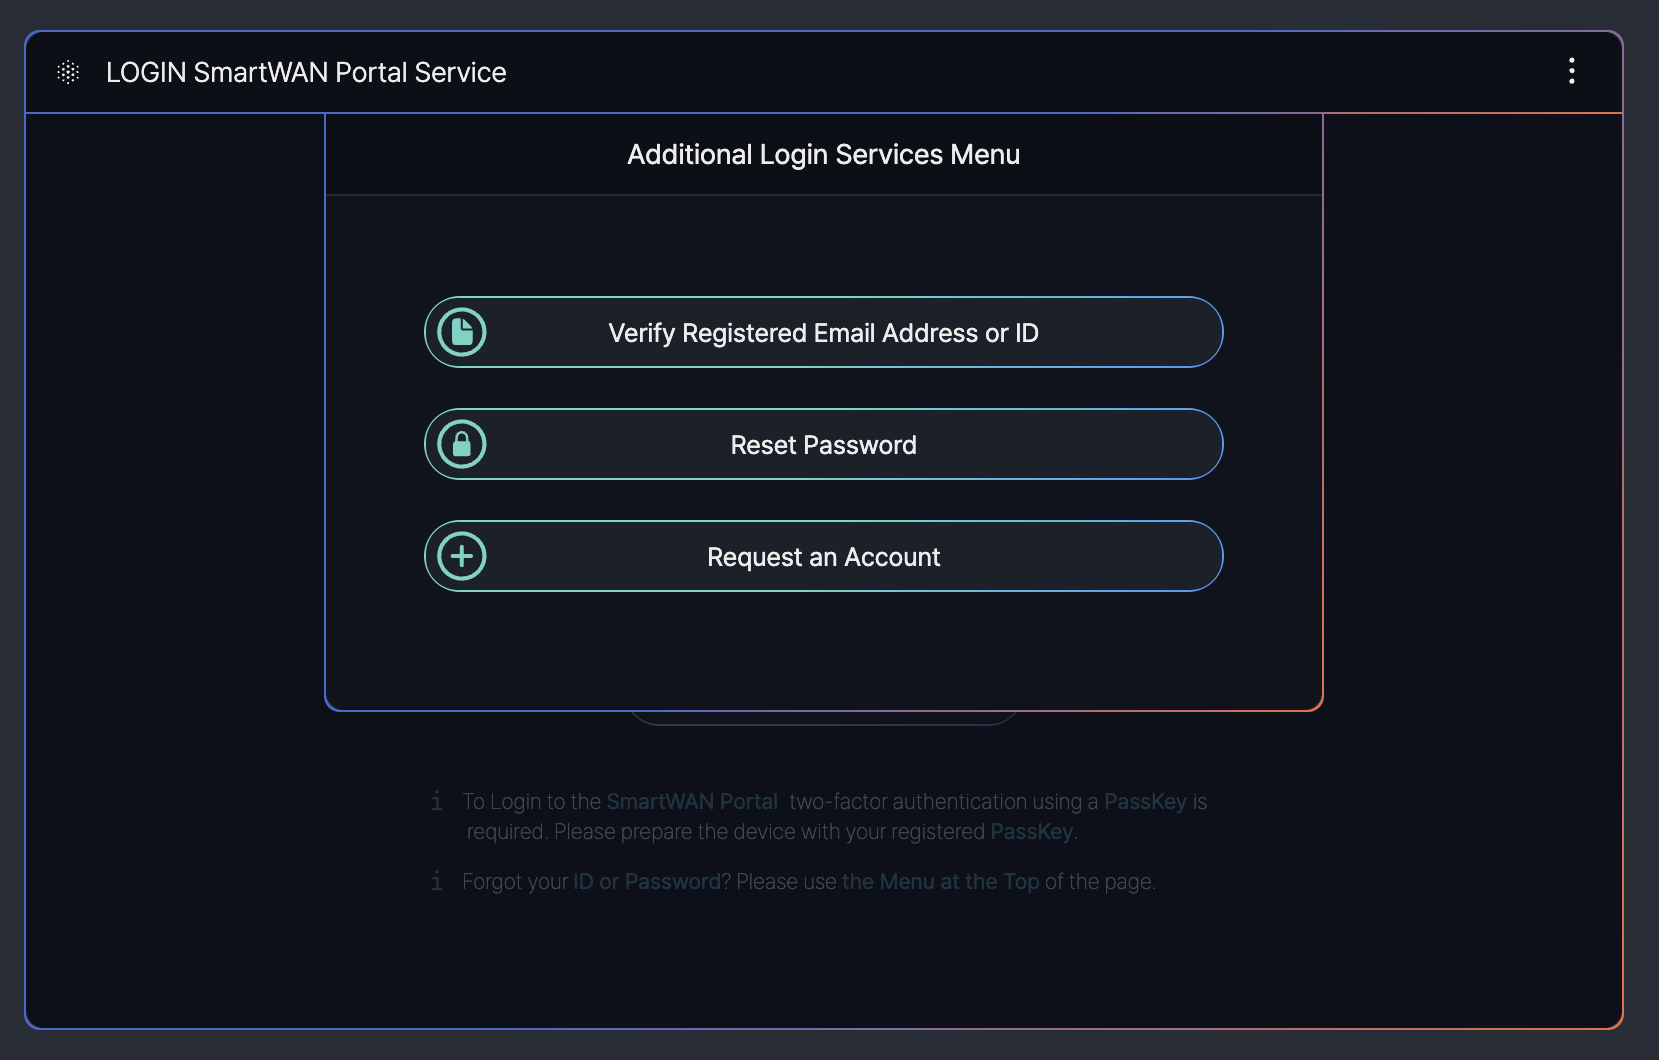
By clicking the "**⋮**" (three dots) icon in the top-right corner, users can access a detailed menu related to user authentication. This menu provides additional options for managing login settings or troubleshooting access issues.
[](https://book.weetizen.com/uploads/images/gallery/2025-04/Xr0image.png)
The "Additional Login Services Menu" provides options to assist users with authentication-related tasks on the SmartWAN Portal login screen. This menu can be accessed by clicking the vertical "⋮" (three dots) icon in the top-right corner of the login screen.
**Menu Options**
- **Verify Registered Email Address or ID**: Allows users to verify their registered email address or ID to ensure they are using the correct credentials for login.
- **Reset Password**: Provides an option for users to reset their password if they have forgotten it or need to update it for security reasons.
- **Request an Account**: Enables new users to request an account if they do not already have one, initiating the account creation process.
Some features described above are currently in the prototype stage and are scheduled for future implementation.
---
#### **Verification Registered Email Address of ID**
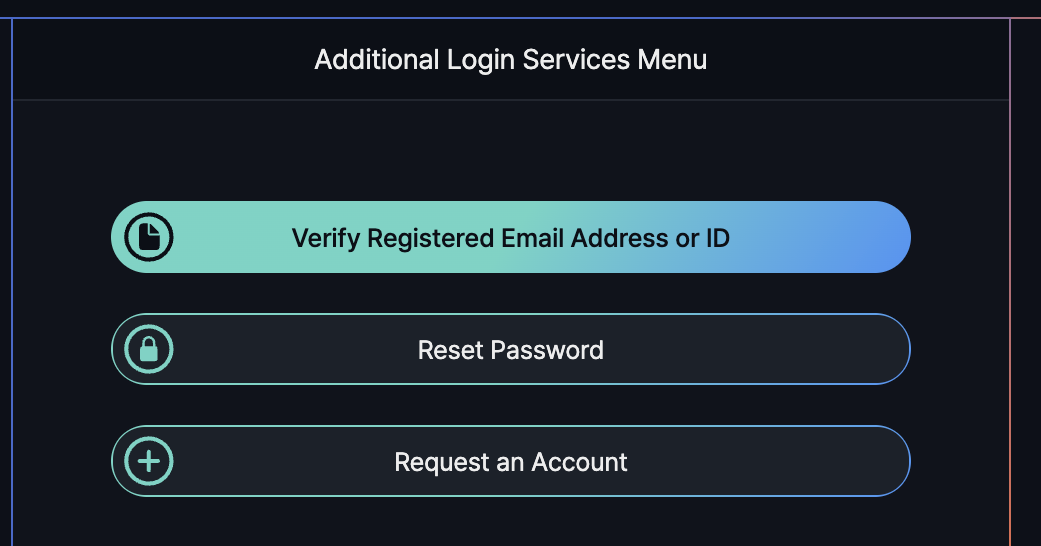
As part of the user verification process in the SmartWAN Portal, the "Verify Registered Email Address or ID" option allows users to confirm their credentials using a PassKey.
[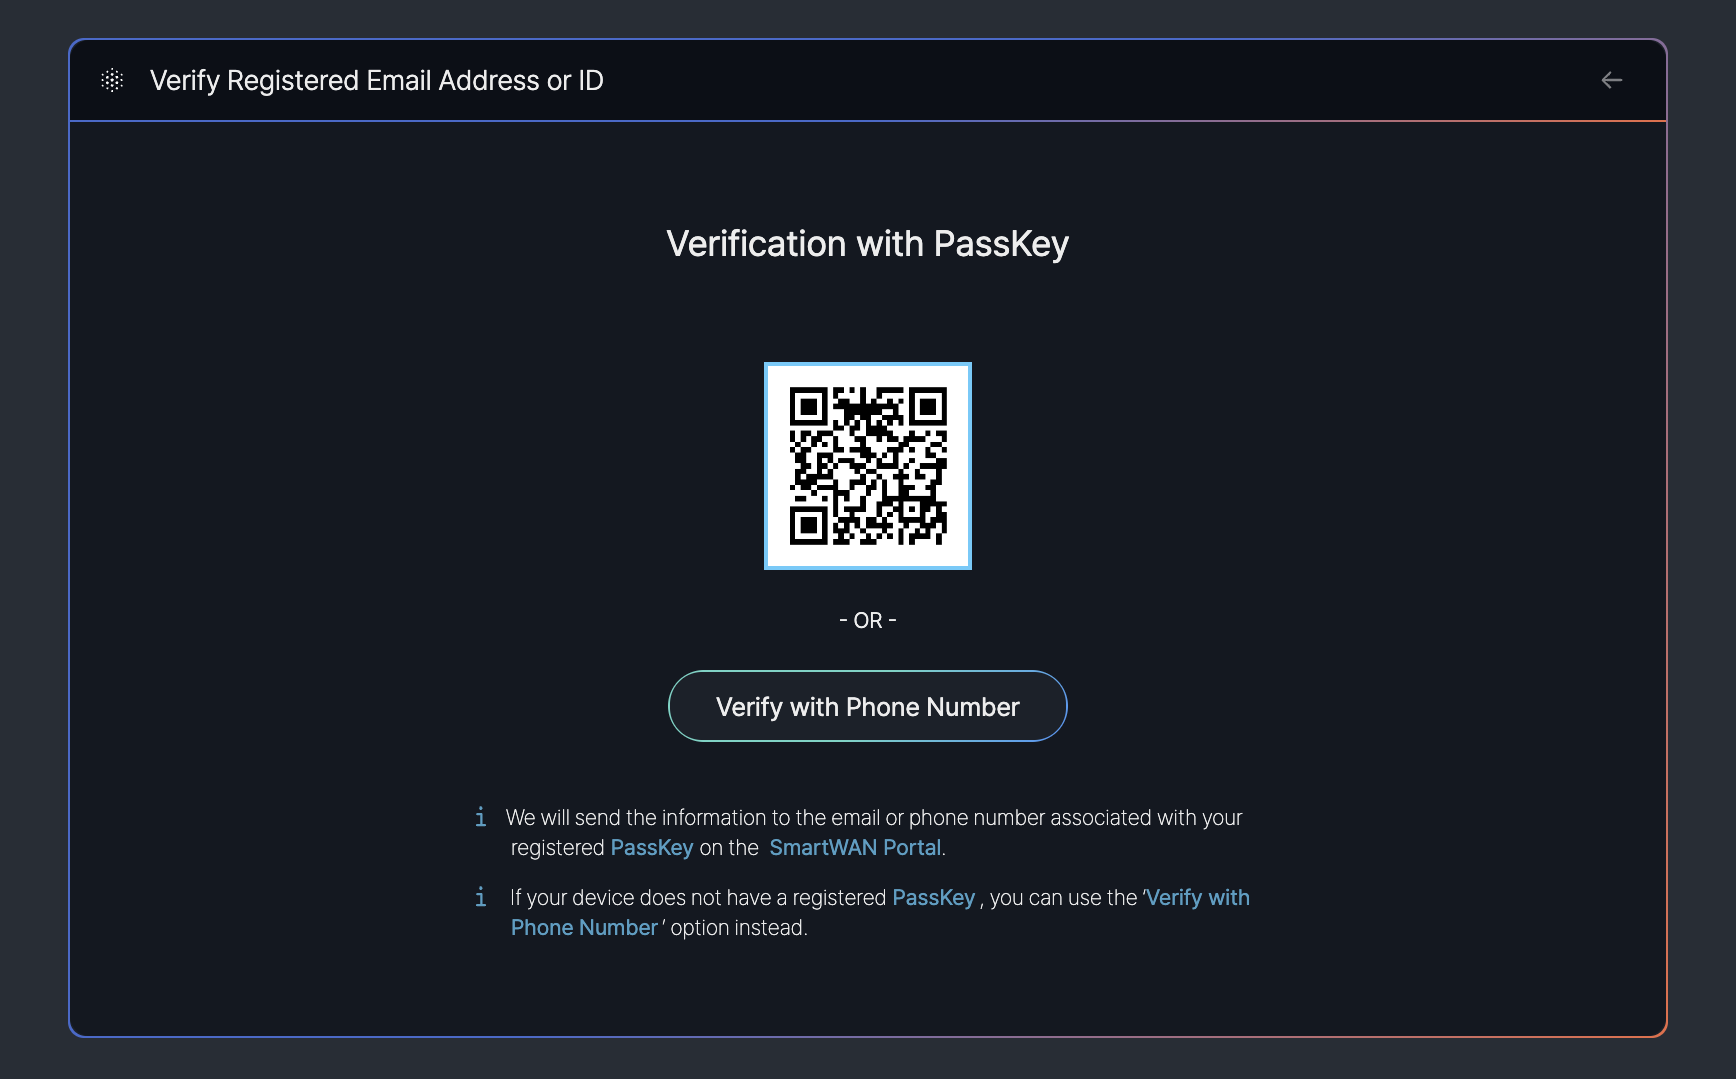](https://book.weetizen.com/uploads/images/gallery/2025-04/kFdimage.png)
**PassKey Verification**: - **QR Code**: A QR code is displayed for users to scan with a device that has a registered PassKey, enabling secure verification.
**Alternative Option**: - **Verify with Phone Number Button**: An alternative "Verify with Phone Number" button is provided for users whose devices do not have a registered PassKey.
---
#### **ResetPassword**
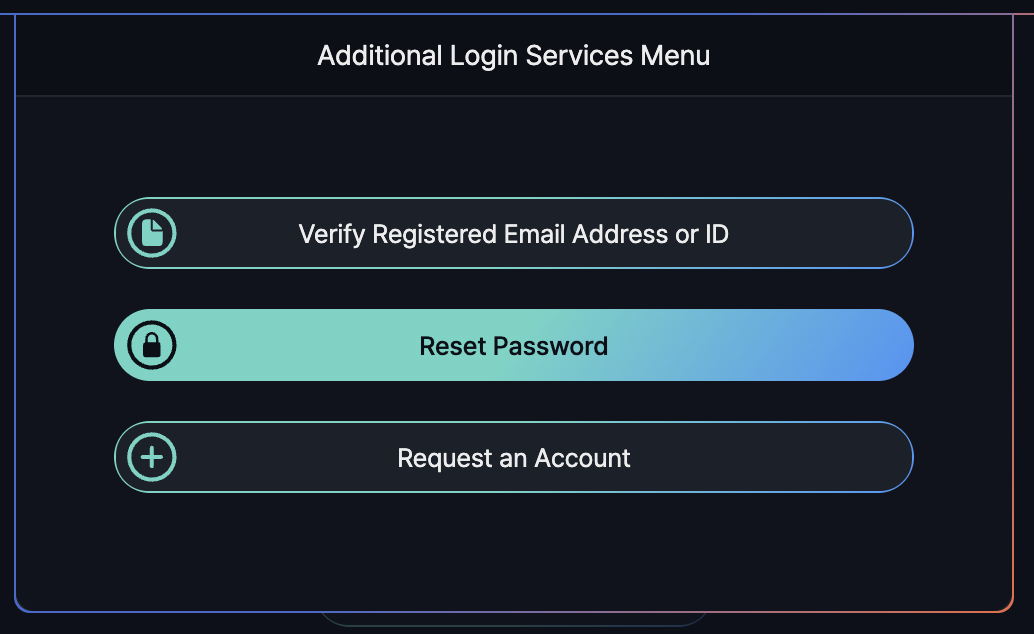
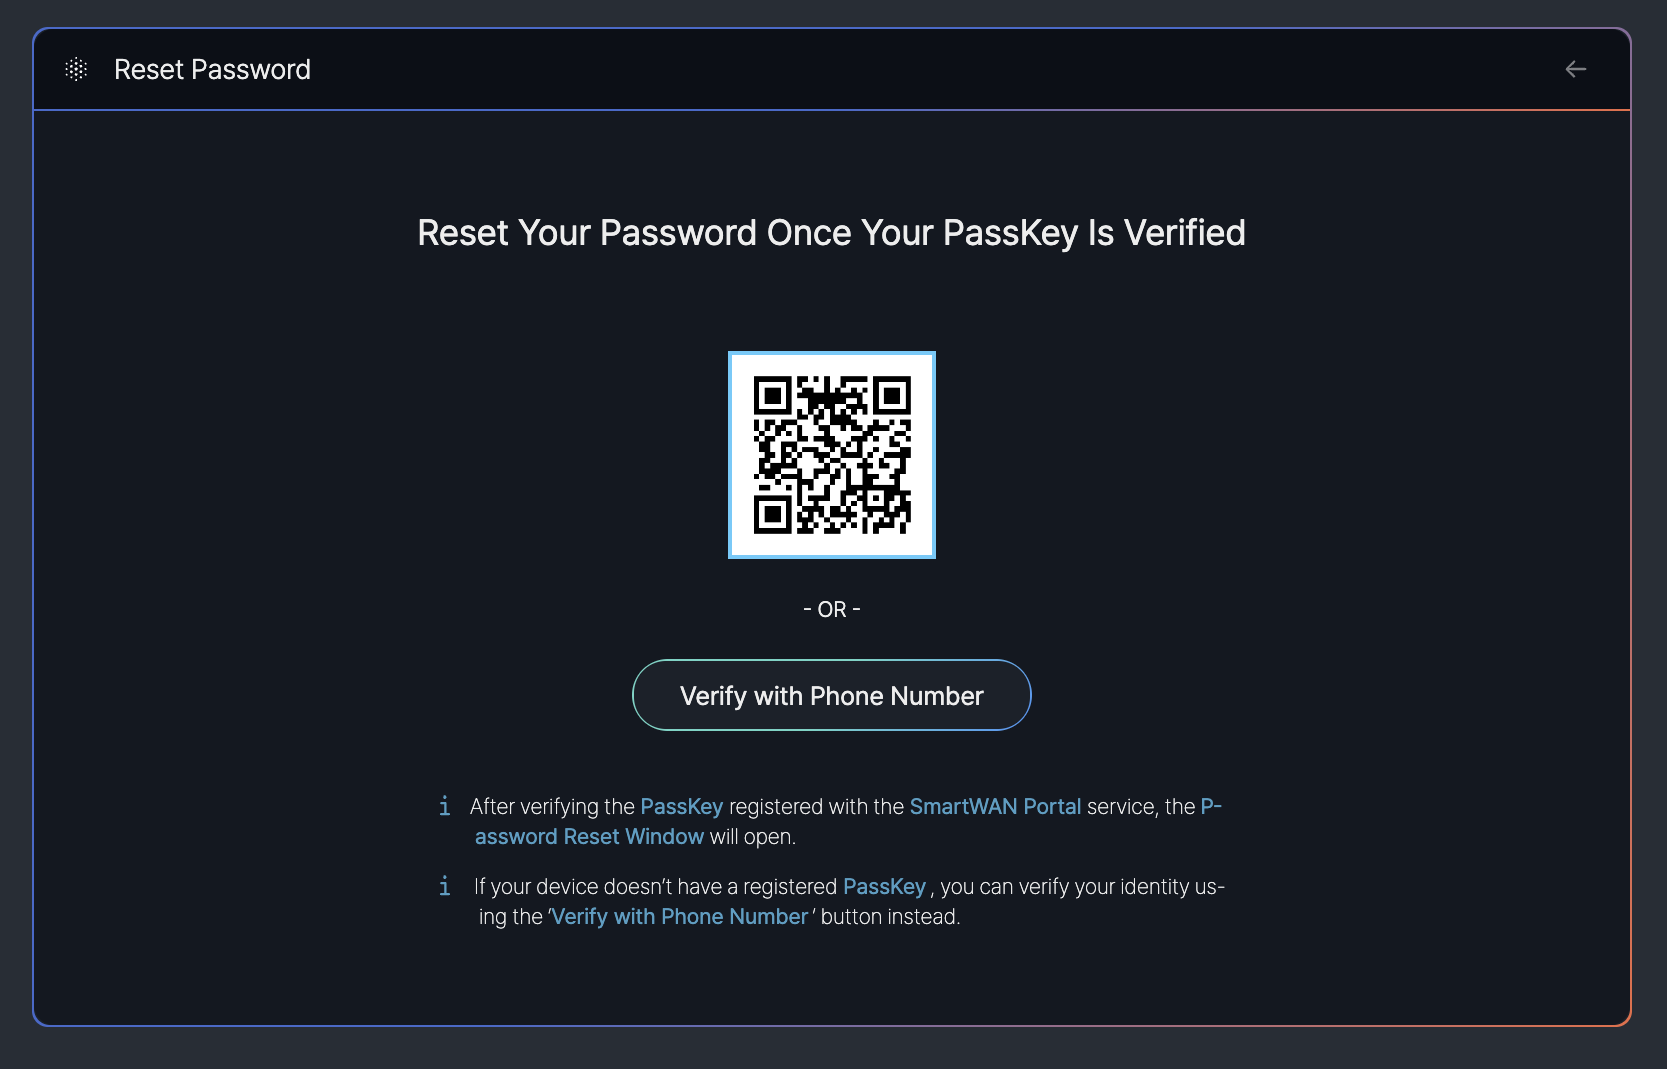
After selecting the "Reset Password" option from the "Additional Login Services Menu" on the SmartWAN Portal, users are directed to the following screen to verify their identity before resetting their password.
[](https://book.weetizen.com/uploads/images/gallery/2025-04/2v7image.png)
**PassKey Verification**: - **QR Code**: A QR code is displayed for users to scan with a device that has a registered PassKey, enabling secure verification prior to password reset.
**Alternative Option**: - **Verify with Phone Number Button**: An alternative "Verify with Phone Number" button is provided for users whose devices do not have a registered PassKey.
[](https://book.weetizen.com/uploads/images/gallery/2025-04/cTlimage.png)
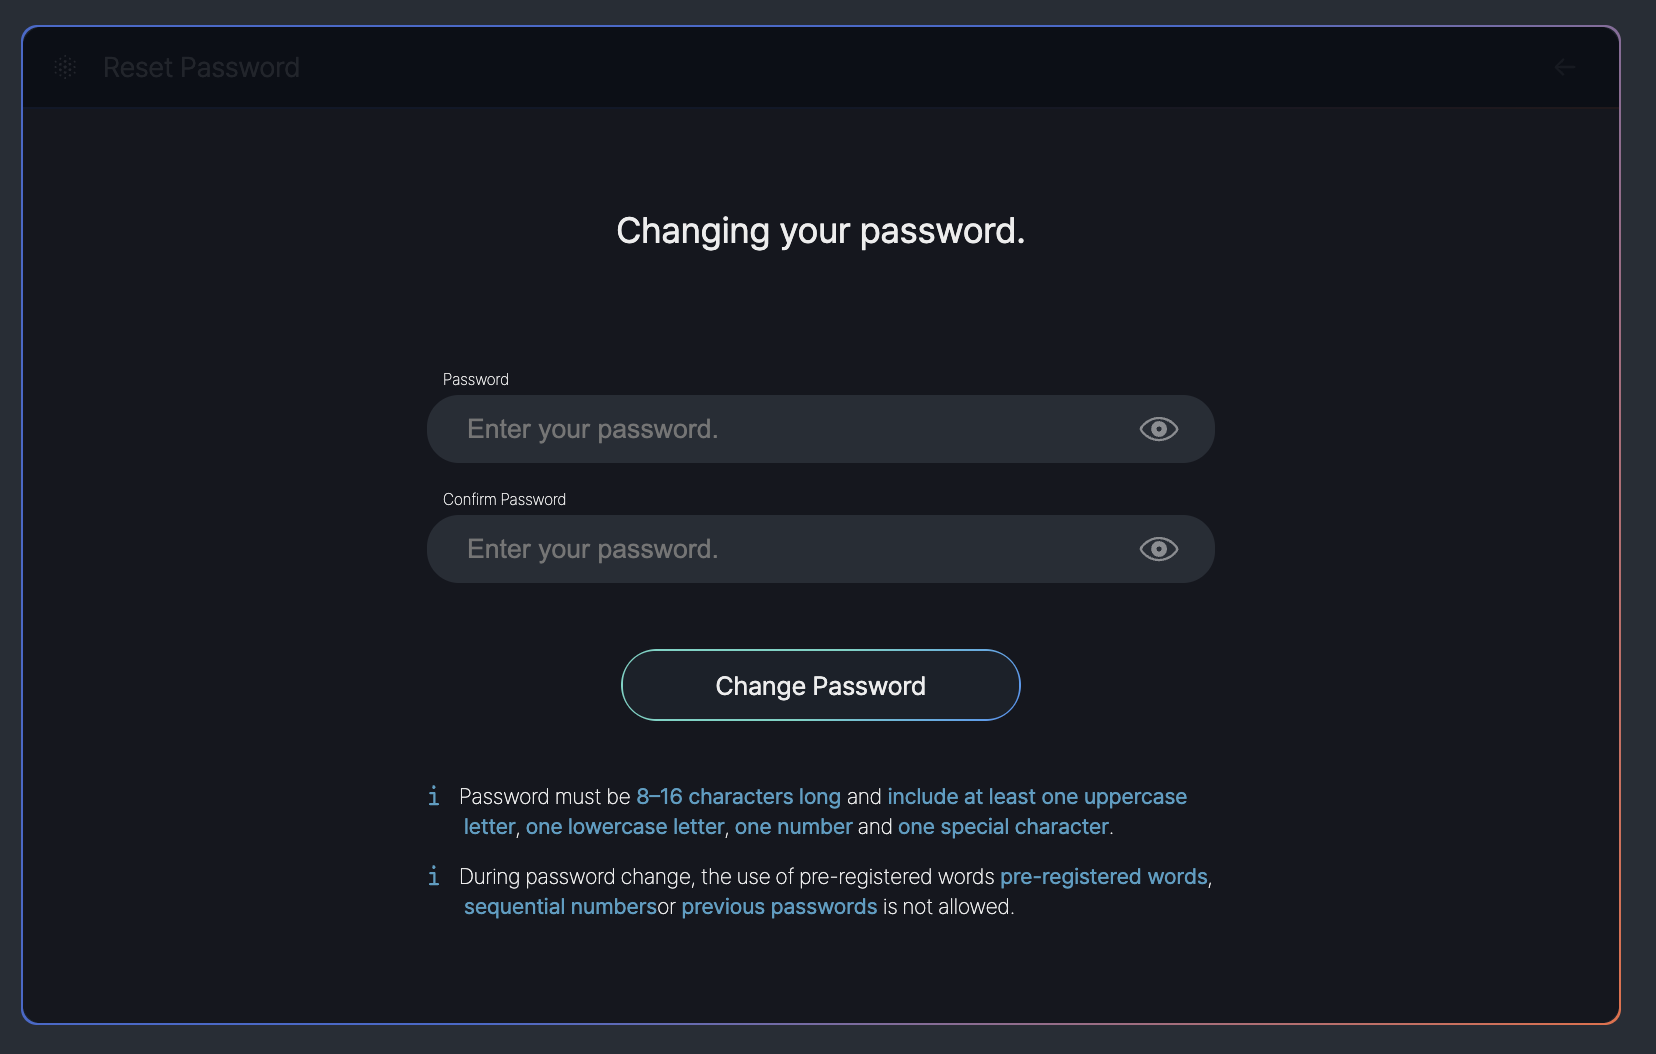
Once the user’s identity is successfully verified using a PassKey or phone number, the SmartWAN Portal provides a screen to change the password. This screen allows users to set a new password following the specified guidelines.
---
#### **Request an Account**
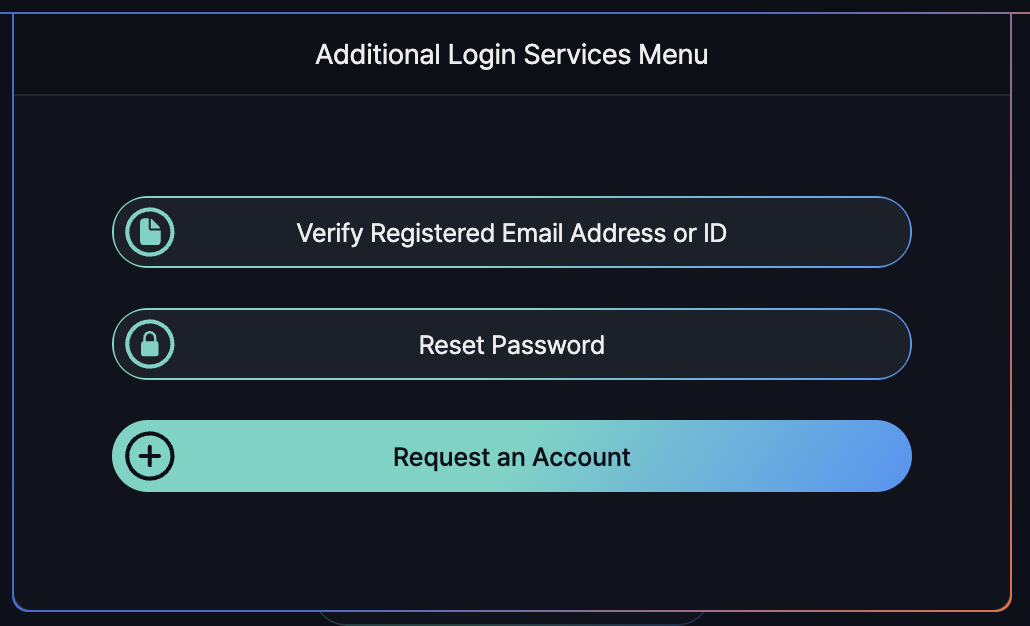
After selecting the "Request an Account" option from the "Additional Login Services Menu" on the SmartWAN Portal, users are directed to the following screen to verify their identity before resetting their password.
[](https://book.weetizen.com/uploads/images/gallery/2025-04/XUdimage.png)
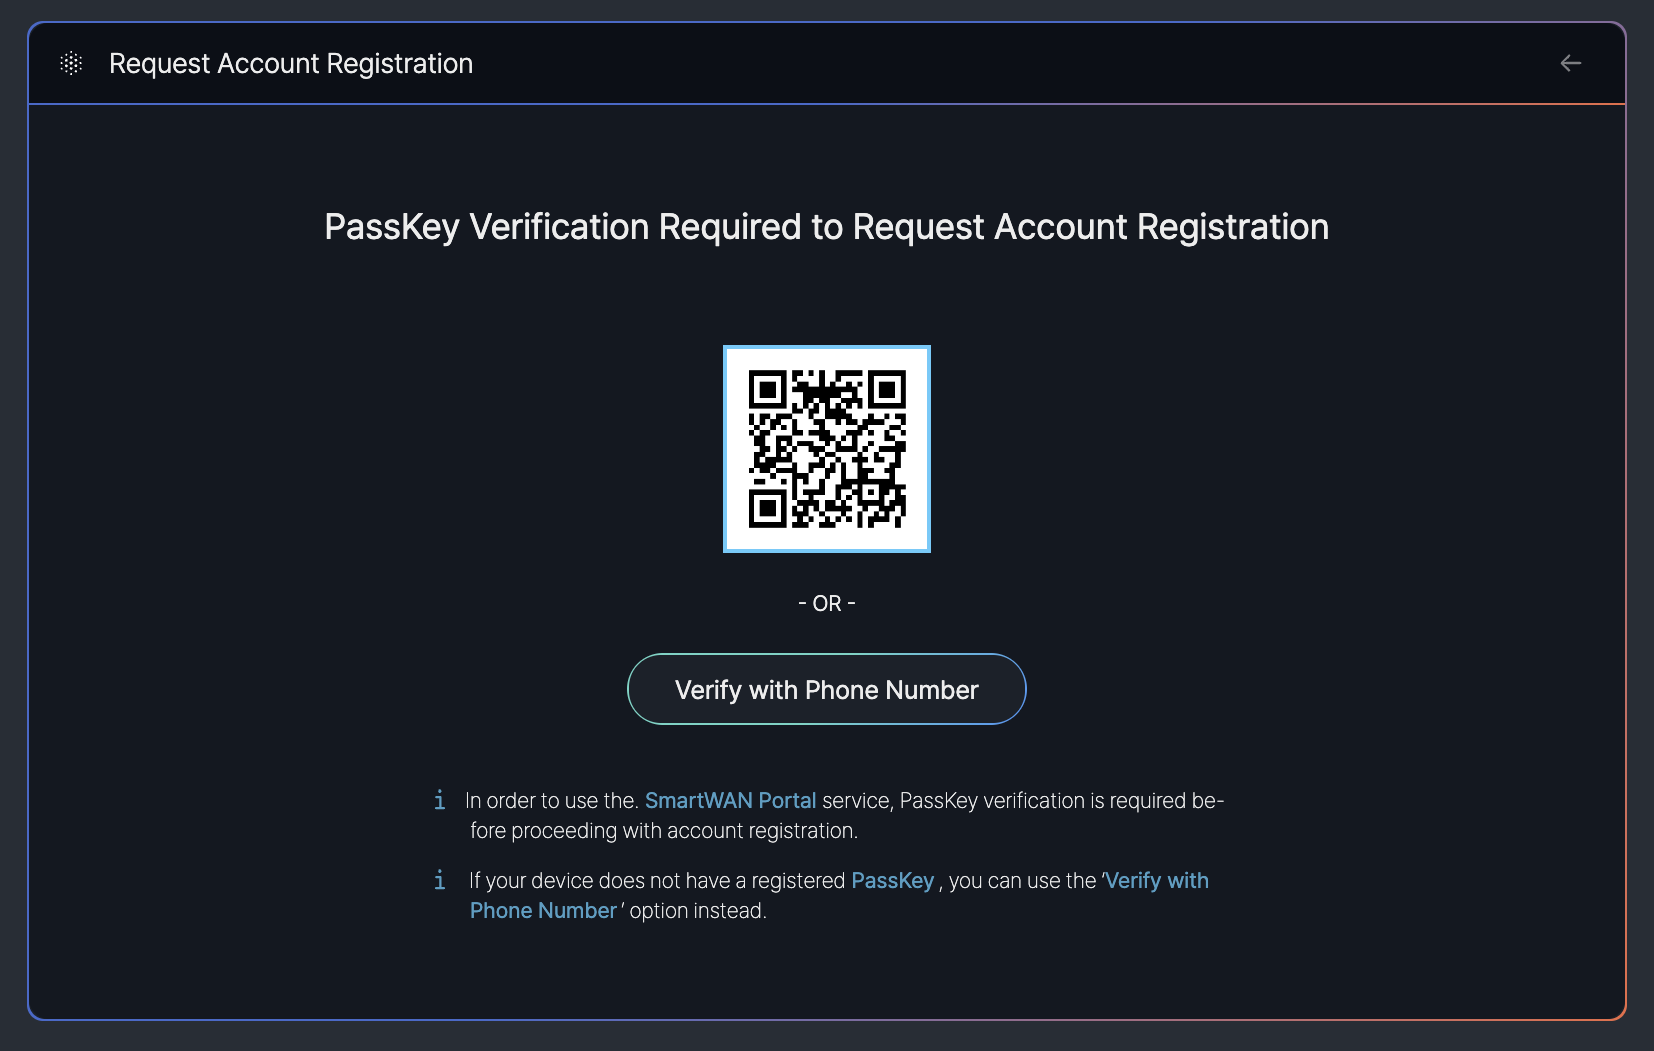
**PassKey Verification**:
- **QR Code**: A QR code is displayed for users to scan with a device that has a registered PassKey, enabling secure verification prior to request an account.
**Alternative Option**:
- **Verify with Phone Number Button**: An alternative "Verify with Phone Number" button is provided for users whose devices do not have a registered PassKey.
[](https://book.weetizen.com/uploads/images/gallery/2025-04/6hVimage.png)
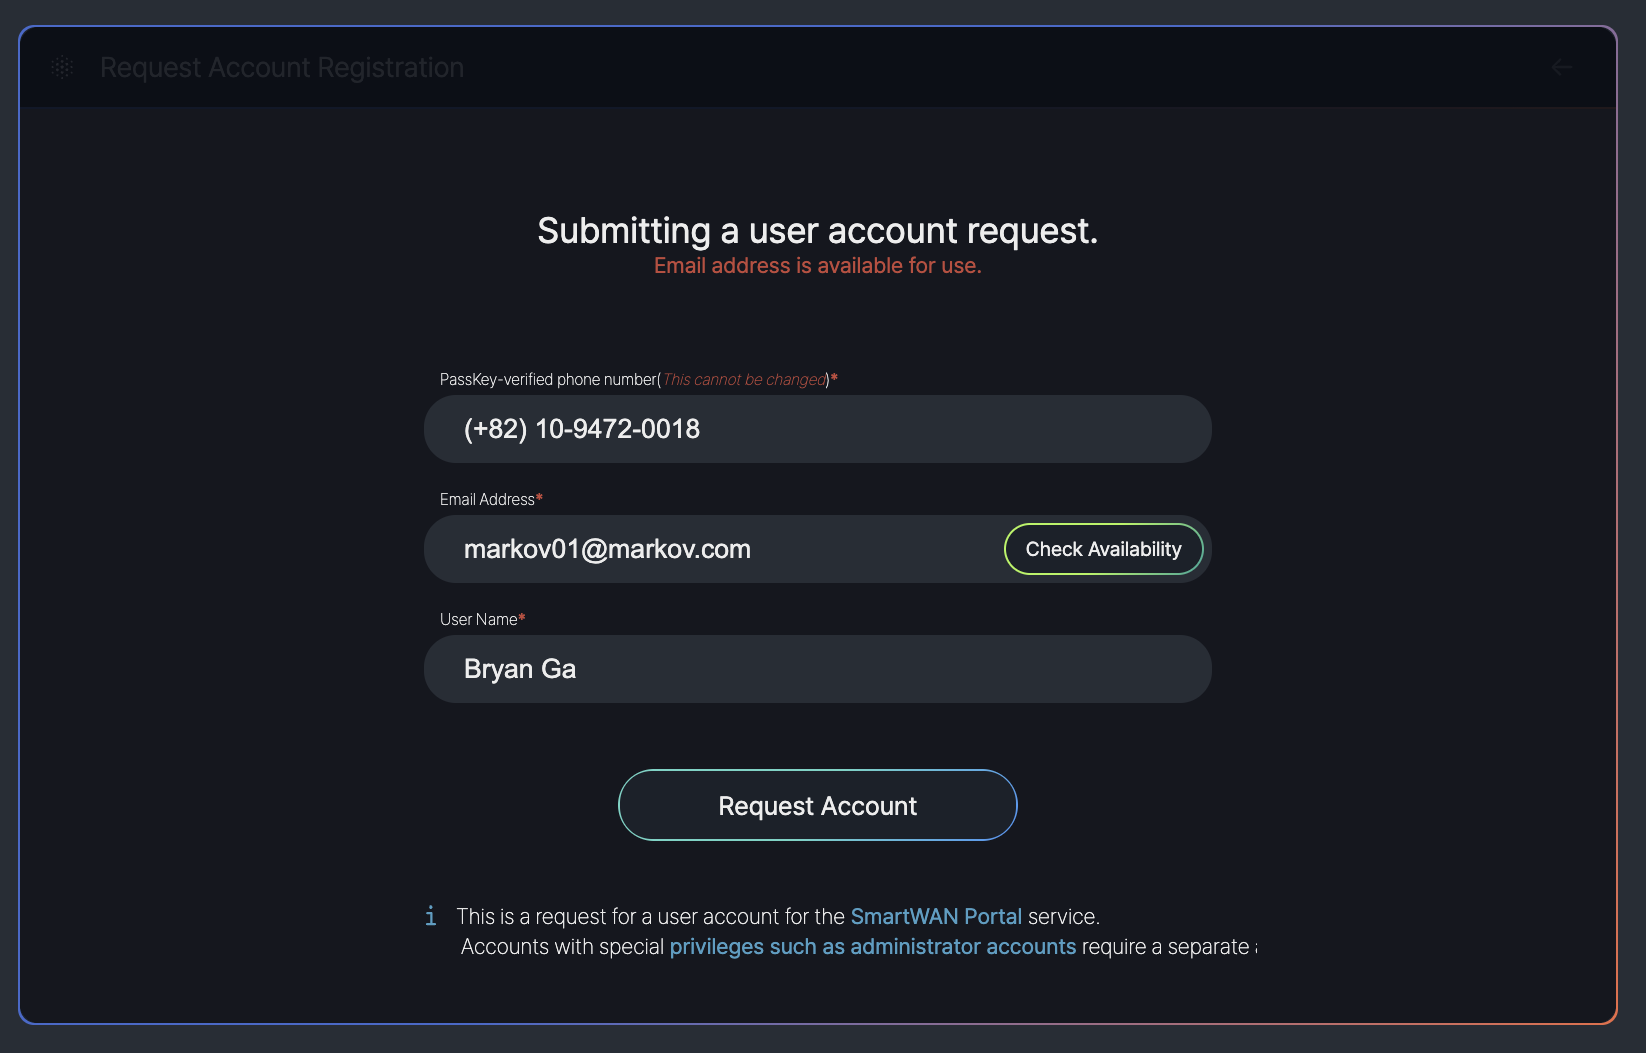
This screen allows users to request a new account by providing their PassKey-verified phone number, email address, and name. After verifying the email availability, users can submit the request using the "Request Account" button.
**Input Fields**: - **PassKey-verified phone number**: Displays a pre-filled, non-editable phone number associated with the PassKey.
- **Email Address**: A field to enter the user’s email address (e.g., "markov01@markov.com"), with a "Check Availability" button to verify if the email is available (status: "Email address is available for use").
- **User Name**: A field to enter the user’s name
[](https://book.weetizen.com/uploads/images/gallery/2025-04/wYwimage.png)
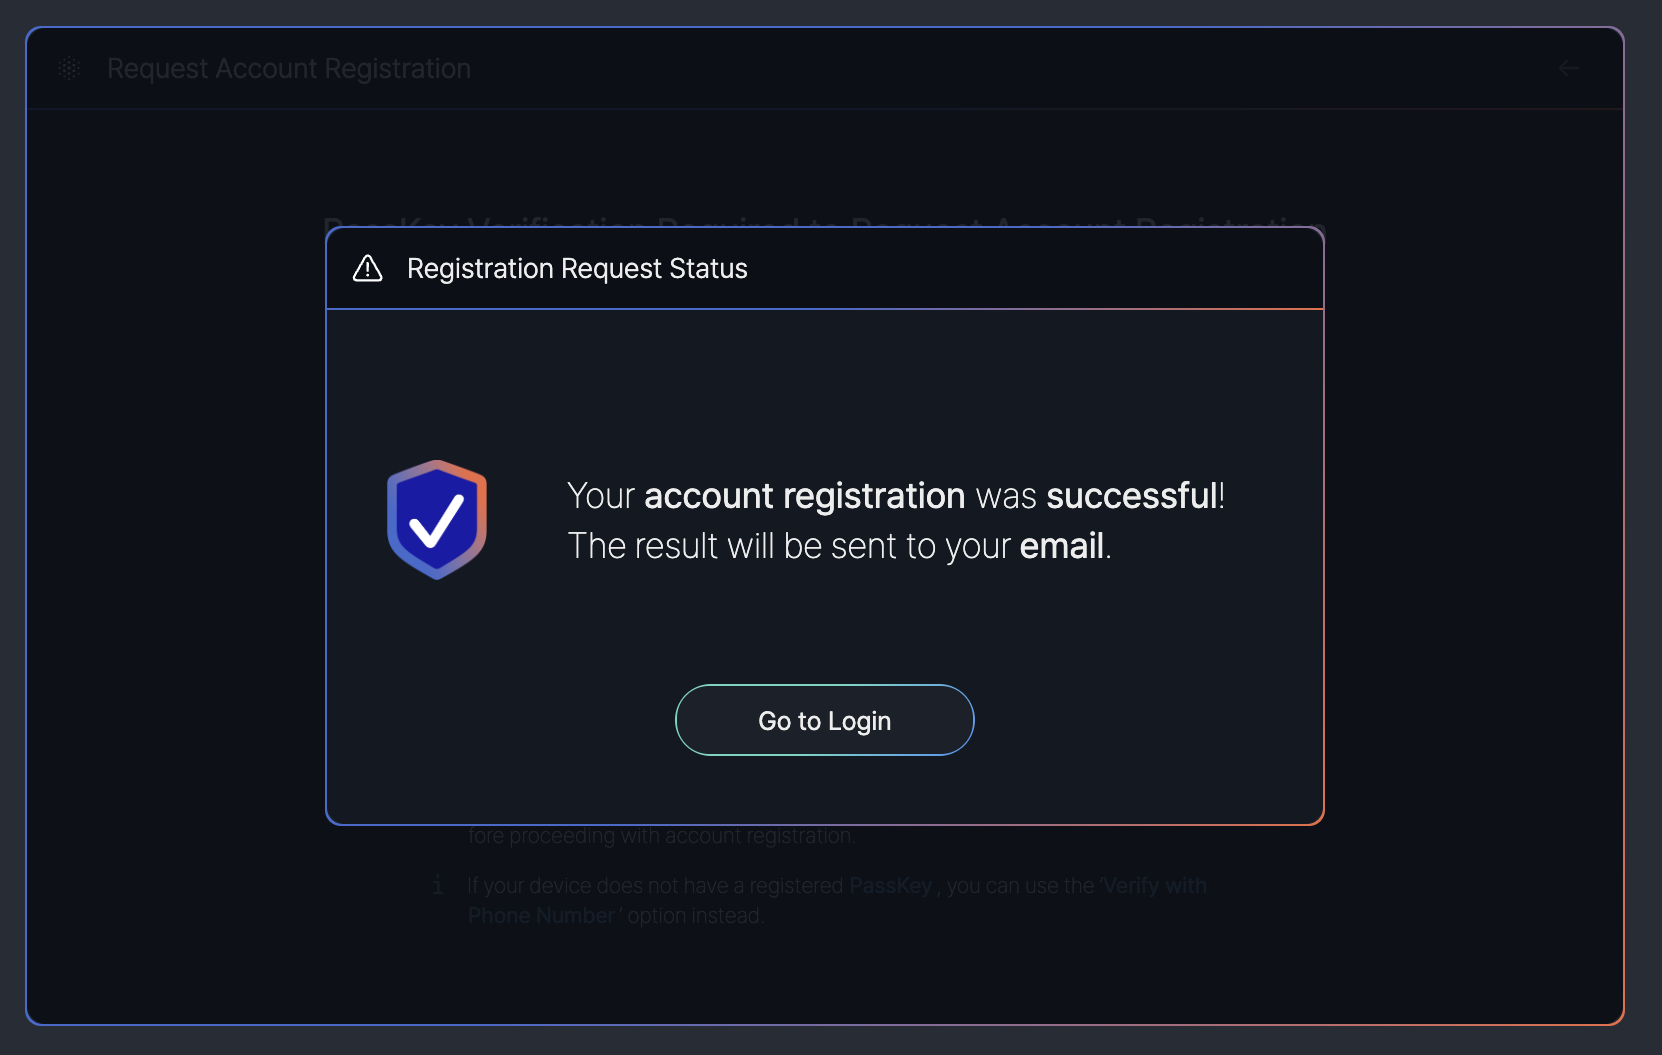
This screen confirms the successful submission of the account request, informing the user that the result will be sent to their email. Users can then click "Go to Login" to return to the login screen and sign in with their new account.
---
#### **User Information and Notifications**
[](https://book.weetizen.com/uploads/images/gallery/2025-04/H1Pimage.png)
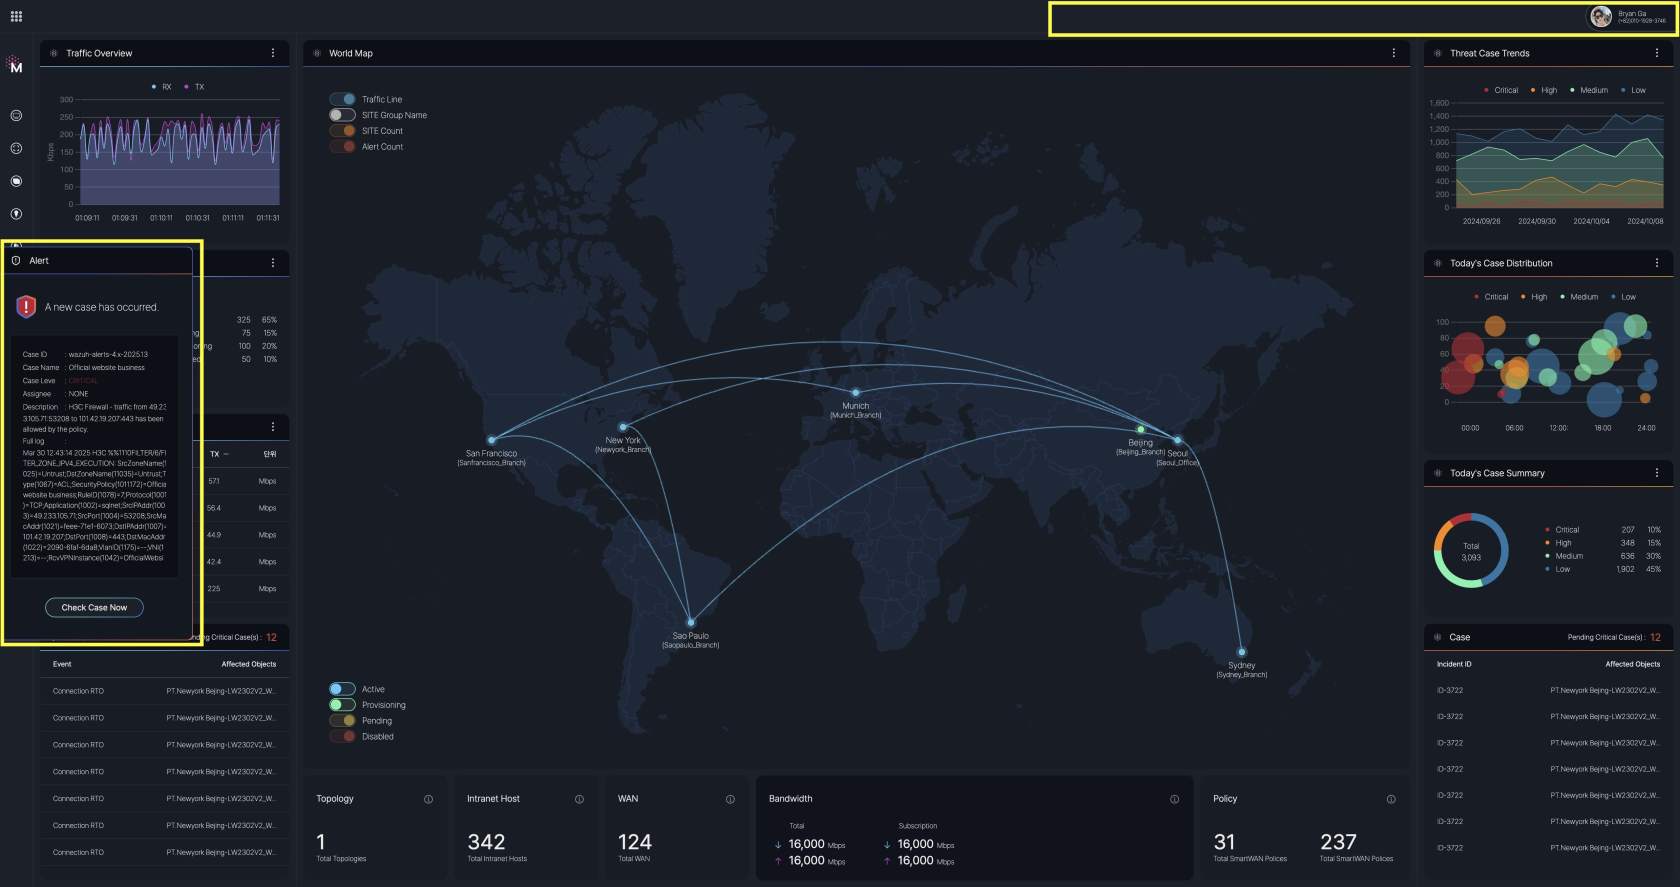
After logging in, you can see the user information adjacent to the top-right corner.
Click on the user information to view additional settings menus and the current status of notifications. Options such as "Logout" and "Account Management" are available for the user to sign out or manage their account settings.

**Real-time Alerts**
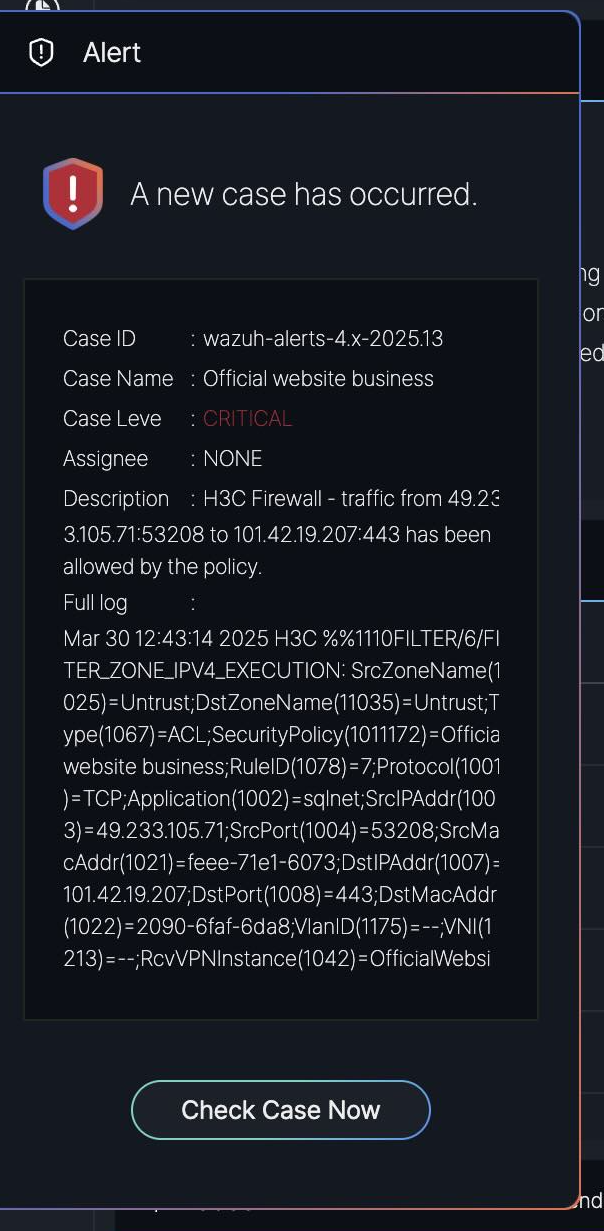
If any alerts need to be provided to the user, an alert message will be displayed on the left side of the screen in real time.
[](https://book.weetizen.com/uploads/images/gallery/2025-04/3Q1image.png)
**Assigned Case Notification**
[](https://book.weetizen.com/uploads/images/gallery/2025-04/CAlimage.png)
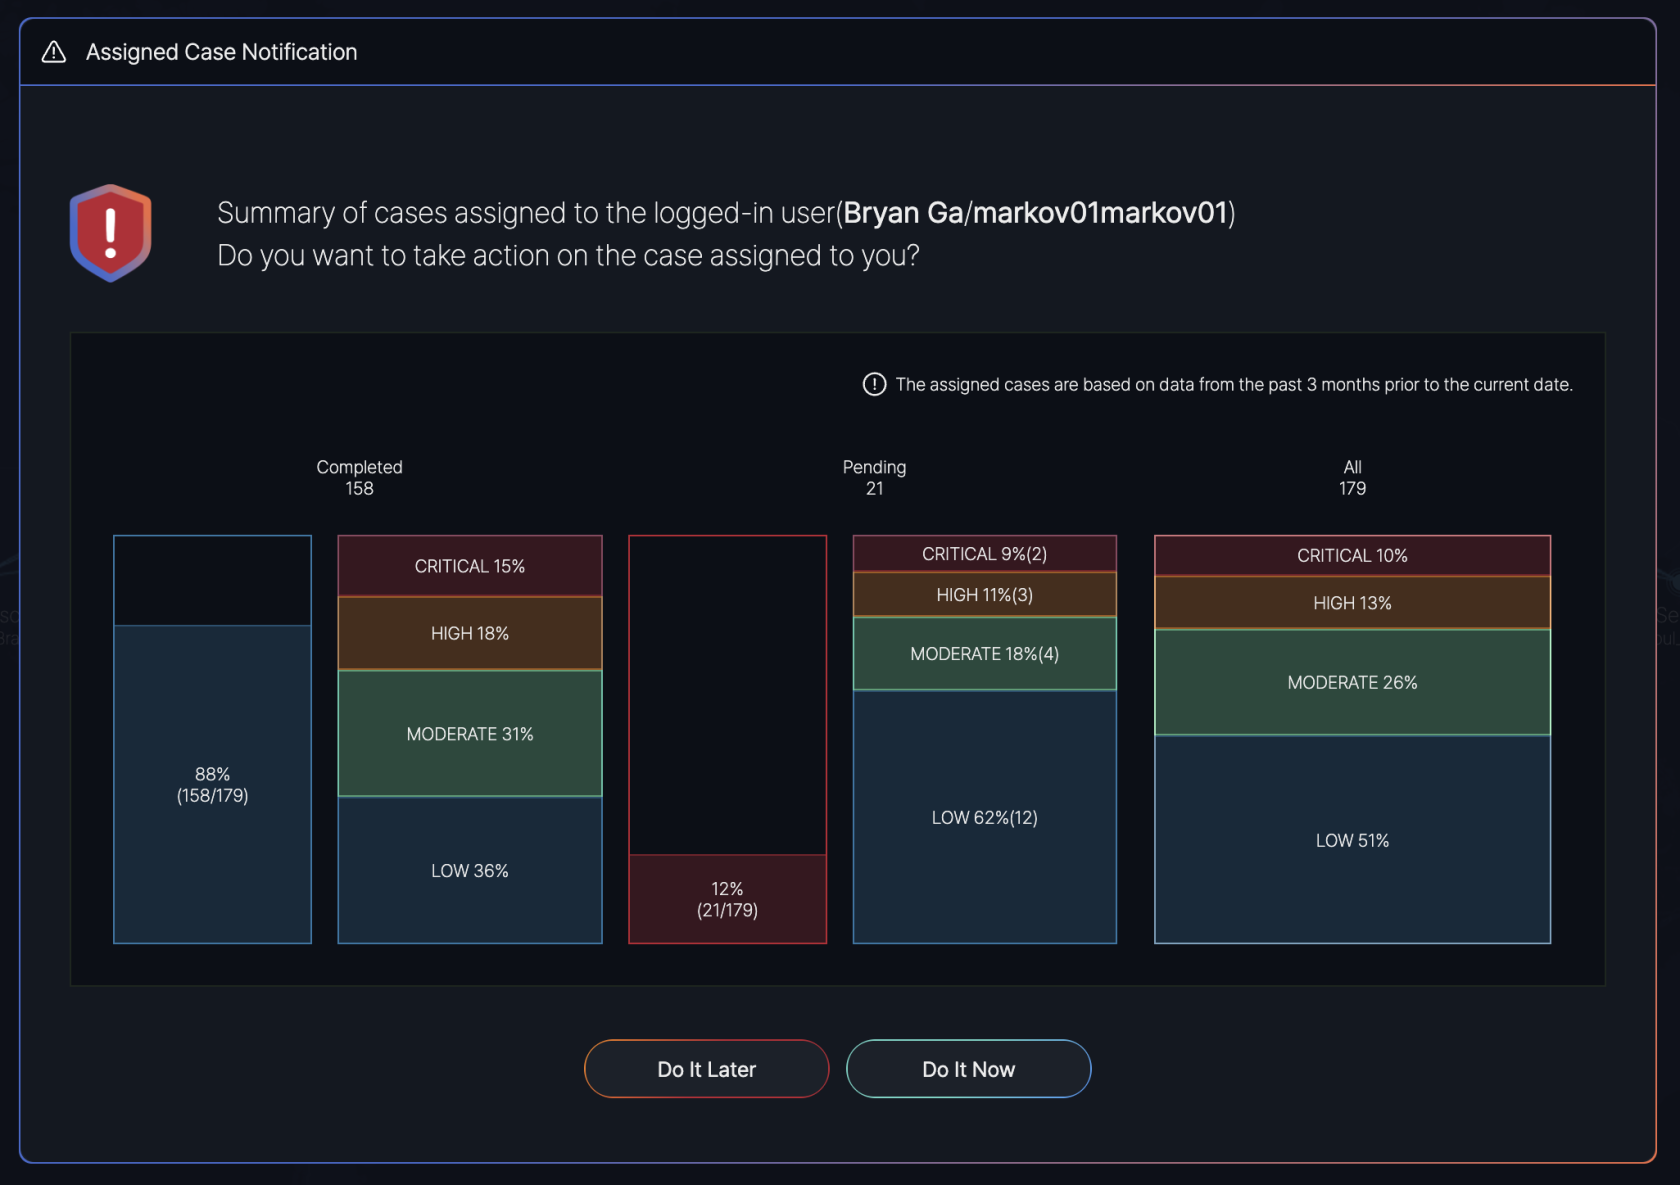
If a user has assigned cases that remain unresolved, a popup notification will appear after logging in to the SmartWAN Portal. This **Assigned Case Notification** alerts the user to the open cases that require attention.
---
#### **Logout**
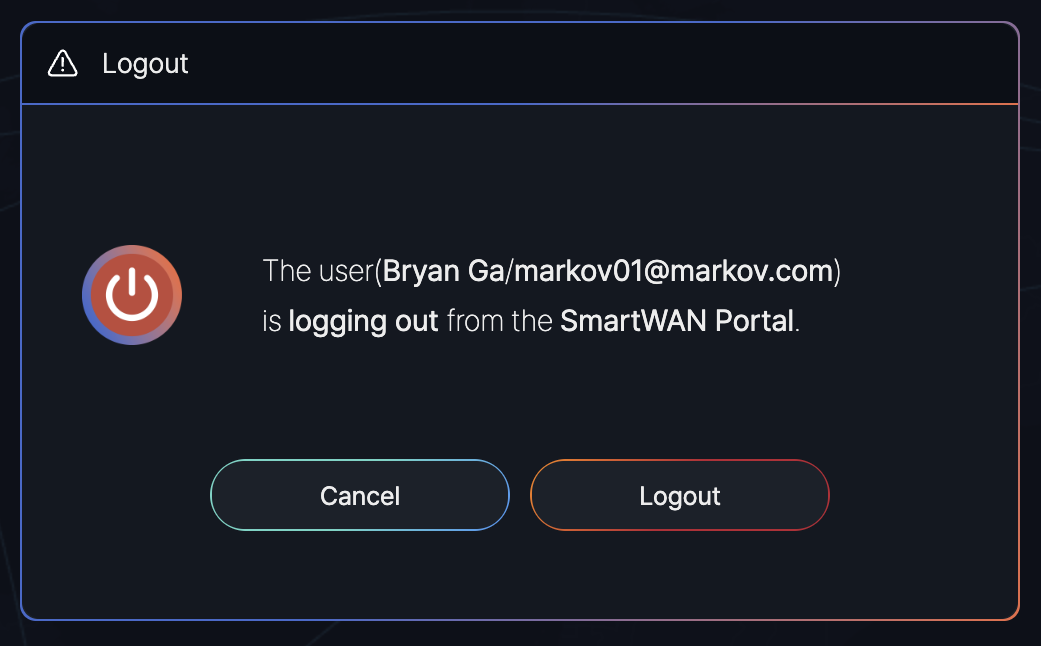
You can log out by clicking the log-out button in the user information.
# Home Screen
Some features described below are currently in the prototype stage and are scheduled for future implementation.
[](https://book.weetizen.com/uploads/images/gallery/2025-04/1.jpg)
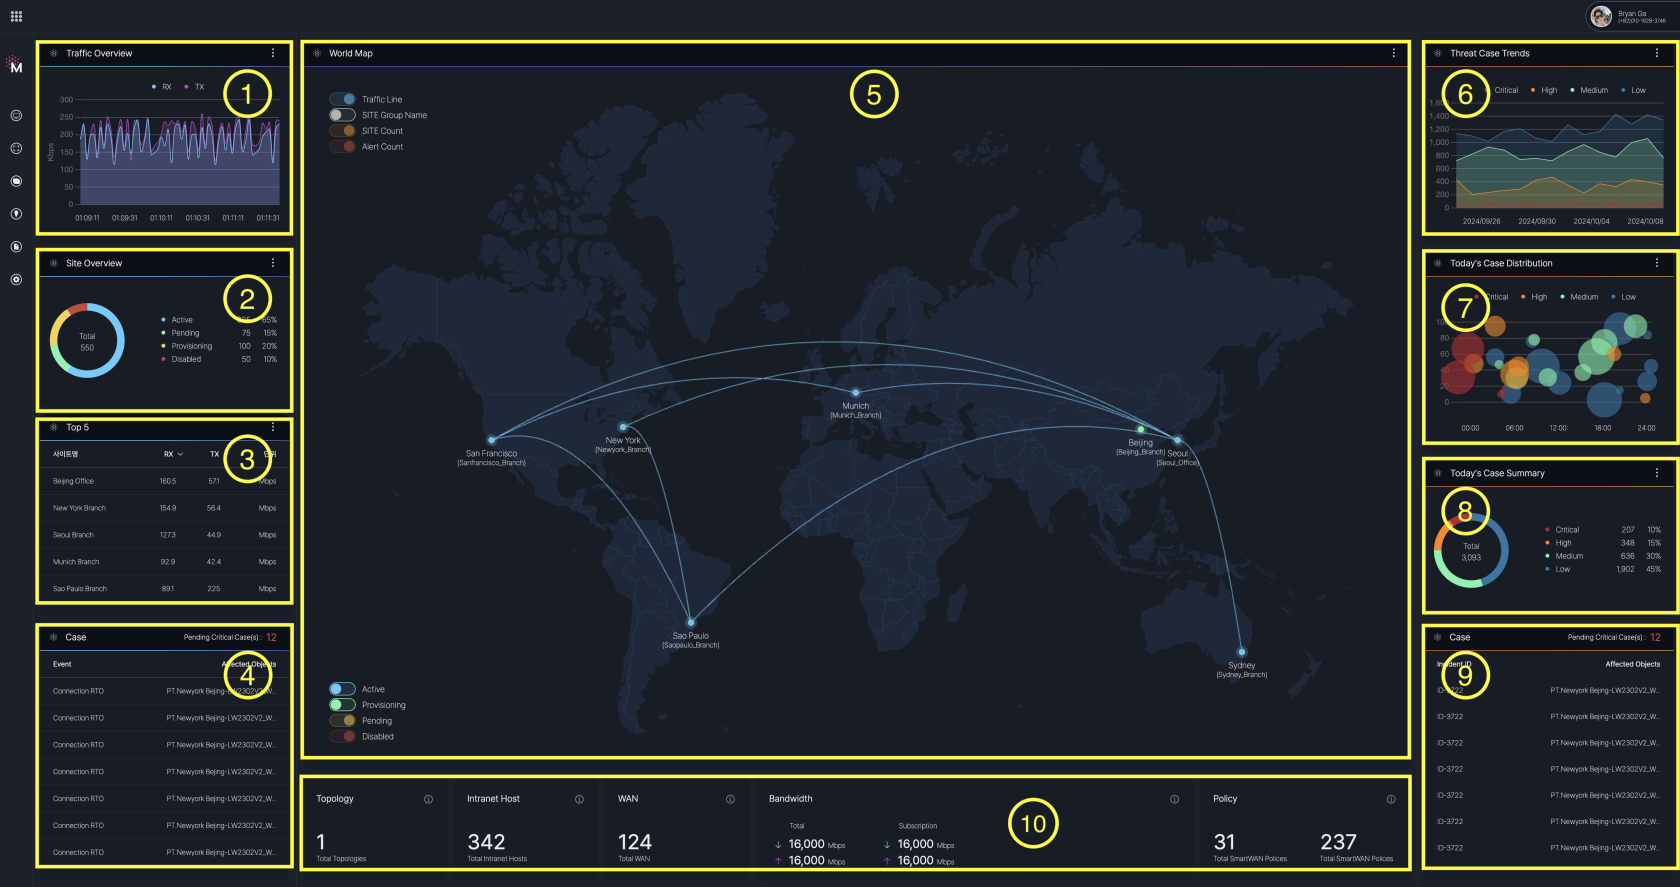
Upon logging in to the SmartWAN Portal, the **Home Screen** automatically appears, providing a comprehensive overview of network and security events across locations worldwide.
#### **Widgets**
[](https://book.weetizen.com/uploads/images/gallery/2025-04/1Qzimage.png)
**1. Traffic Widget**
- **Description**: Displays real-time network traffic data over a selected time period (e.g., last 24 hours). The graph shows RX (receive) and TX (transmit) traffic in Mbps, with peaks and trends.
**2. Site Overview**
- **Description**: Shows a summary of the status sites.
**3. Top5**
- **Description:** Displays the top 5 sites ranked by network traffic
**4. Case**
- **Description:** Lists critical cases and their affected objects, and provides on pending critical cases
**5. World Map(Map view)**
- **Description:** Provides a global map view of locations, with lines indicating connectivity between sites (e.g., Munich, New York, San Francisco, Sao Paulo, Sydney).
**6. Threat case trends**
- **Description:** A line graph showing trends in threat cases over time. Categories include Critical, High, Medium, and Low, with data points indicating case counts.
**7. Today's Case Distribution**
- **Description:** A scatter plot visualizing the distribution of cases by severity (Critical, High, Medium, Low) over a 24-hour period. Each bubble represents a case, with size indicating the number of incidents (e.g., Critical: 207 cases).
**8. Today's Case Summary**
- **Description**: A pie chart summarizing the total cases for the day.
**9. Case**
- **Description**: A table shows that case-affected objects.
**10. Network Summary Metrics**
- **Topology**:
- **Total Topologies**: Displays the total number of network topologies (e.g., 1).
**Intranet Host**:
- **Total Intranet Hosts**: Shows the total number of intranet hosts connected (e.g., 342).
**WAN**:
- **Total WAN**: Indicates the total number of Wide Area Network (WAN) connections (e.g., 124).
**Bandwidth**:
- **Total Bandwidth**: Displays the total bandwidth capacity for both download (↓) and upload (↑) in Mbps (e.g., 16,000 Mbps for both).
- **Subscription Bandwidth**: Shows the subscribed bandwidth for both download (↓) and upload (↑) in Mbps (e.g., 16,000 Mbps for both).
**Policy**:
- **Total SmartWAN Policies**: Lists the total number of SmartWAN policies in place (e.g., 31).
- **Total SmartWAN Policies (Subscription)**: Indicates the number of subscribed SmartWAN policies (e.g., 237).
The widgets provided on the dashboard may be modified in the future based on evolving requirements.
#### **Map Submenu**
After logging in to the SmartWAN Portal, the Home screen displays the world map by default, featuring a world map in the "Map View." On the right side of the map, users can access additional options through the Map Submenu.
[](https://book.weetizen.com/uploads/images/gallery/2025-04/By2image.png)
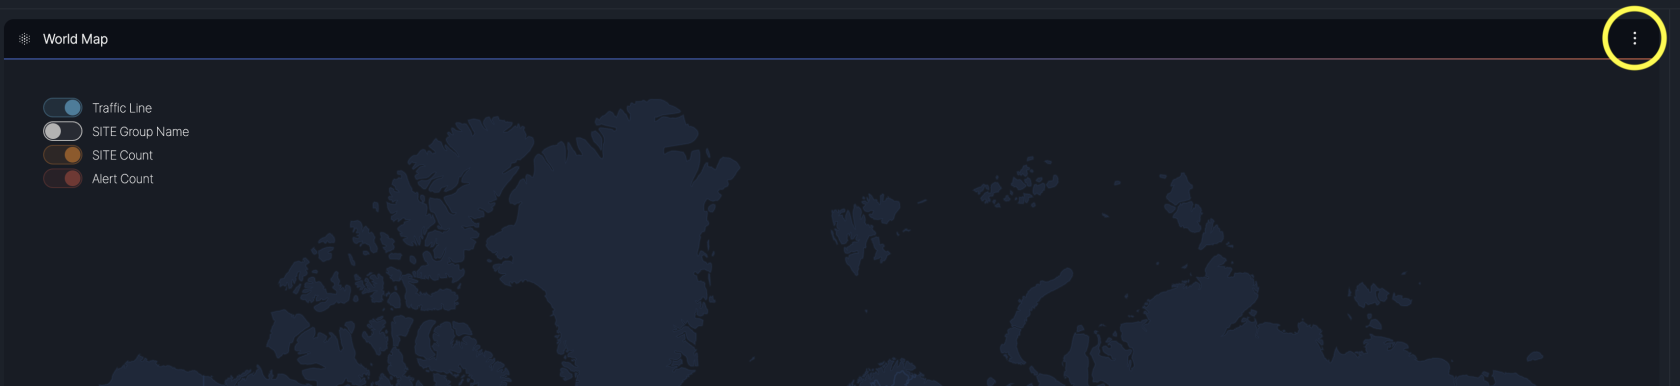
Click the vertical "⋮" (three dots) icon to open the **Map Sub Menu**. This menu allows users to filter and view site information based on specific criteria
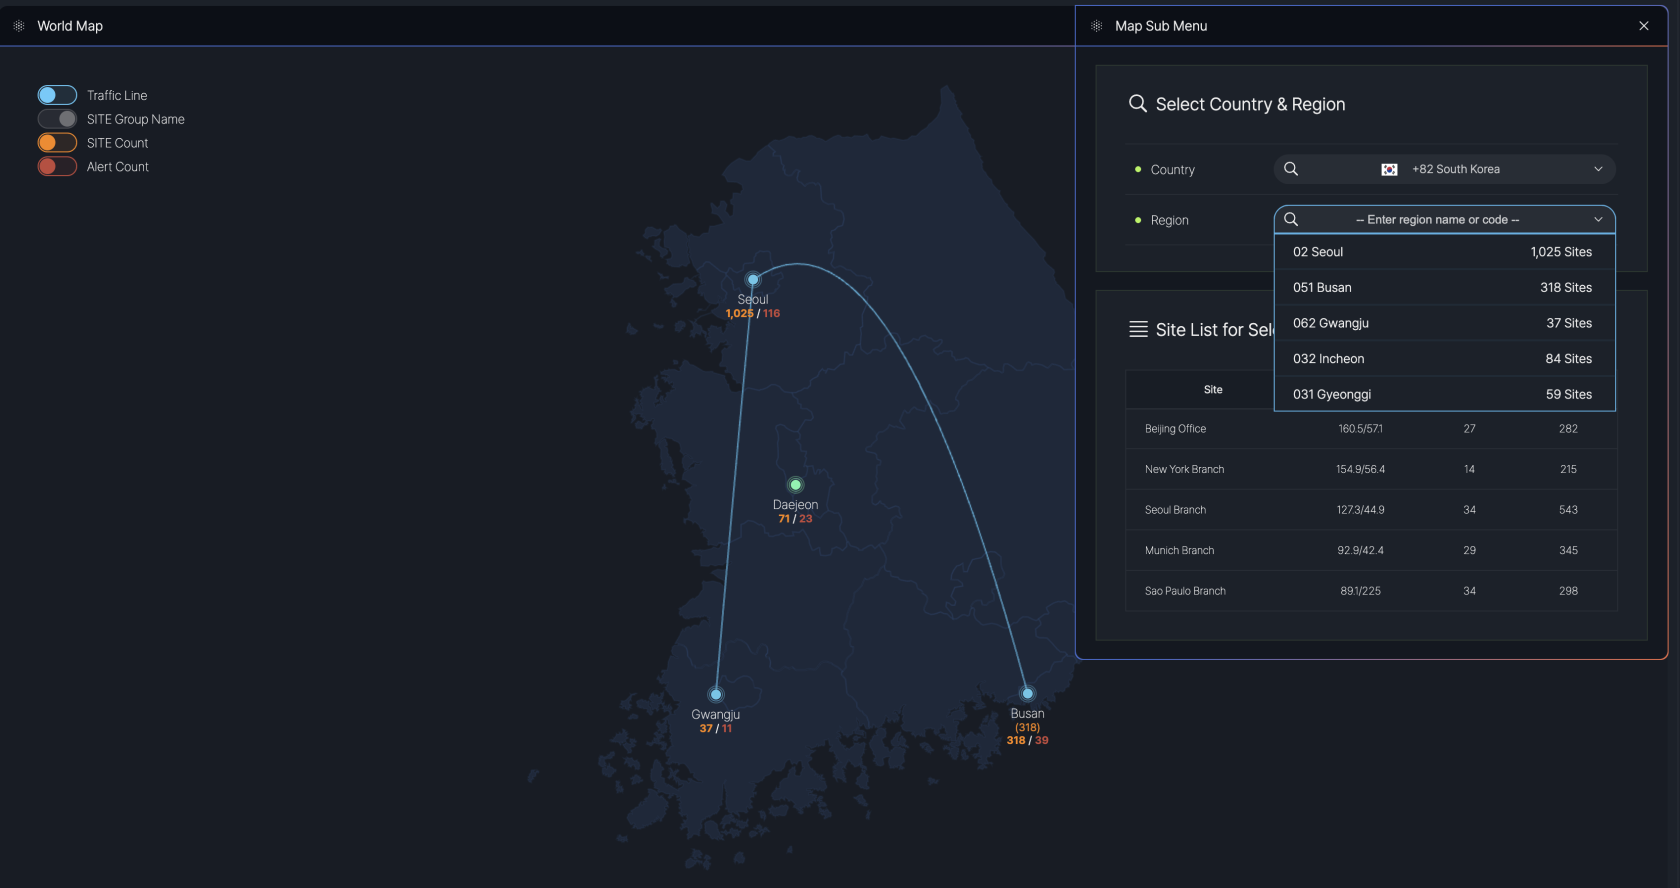
- **Select Country & Region**:
- **Country**: A dropdown menu to select a country (e.g., South Korea, USA, China, Germany, Japan).
- **Region**: A dropdown menu to select a region within the chosen country (e.g., USA > California).
- **Site List**:
- After applying the country and region filters, a list of sites within the selected area is displayed.
- The list includes columns such as:
- **Site**: Name of the site (e.g., Head Office, New York Branch).
- **RX/TX (Mbps)**: Network traffic data for receive (RX) and transmit (TX) in Mbps.
- **Critical Cases**: Number of critical cases associated with the site.
- **All Cases**: Total number of cases for the site.
[](https://book.weetizen.com/uploads/images/gallery/2025-04/mmuimage.png)
The image above shows the **Map Sub Menu** with the country filter set to South Korea and the region dropdown expanded, displaying available regions. The map and site list reflect the filtered view for South Korea, with detailed metrics for each site.
# Dashboard
#### **Getting Started**
**Logging In with an Accessible User Account**
To begin, log in using a user account with access privileges.
You can find more options for [**user authentication**](https://book.weetizen.com/books/appex-opensase/page/authentication "User Athentication").
[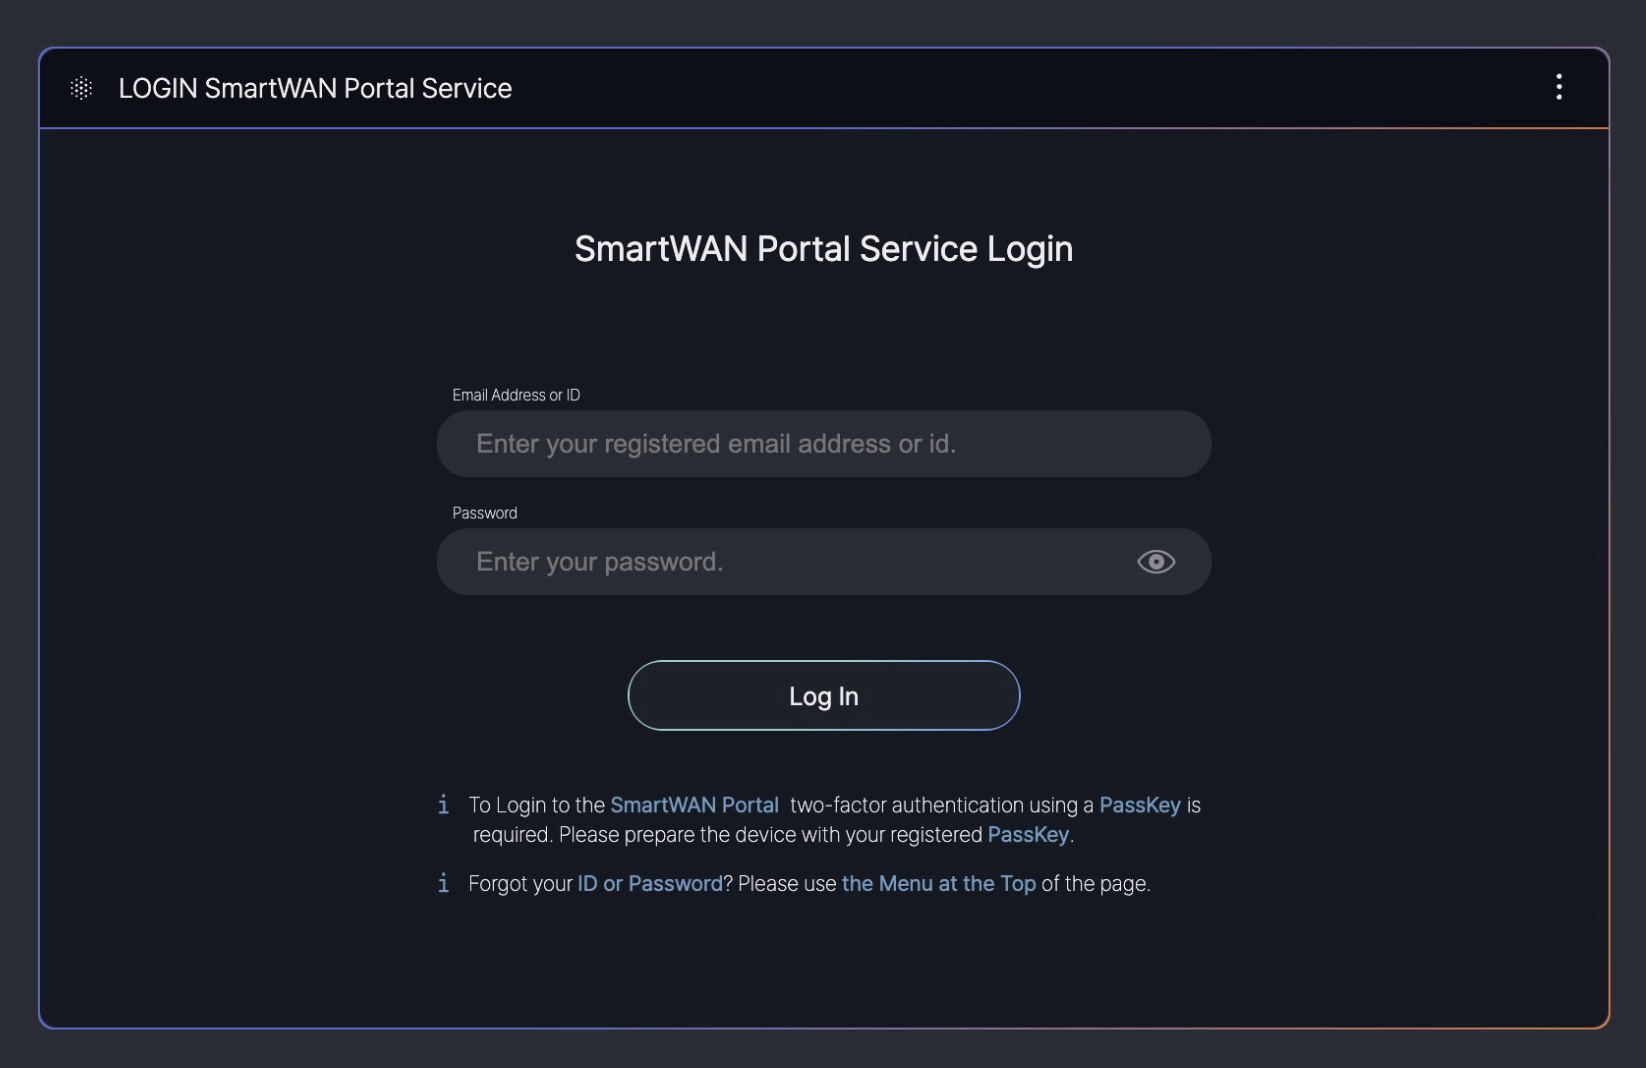](https://book.weetizen.com/uploads/images/gallery/2025-03/2025-03-30-7-53-58.png)
This guide is based on SKT’s SmartWAN Portal. Updates will be continuously applied to reflect future changes.
---
#### **Pre-Configured Dashboards**
The system currently offers three pre-configured dashboard types for users.
The visualization of data provided by the SmartWAN Portal is categorized into three distinct types. Upon accessing the SmartWAN Portal, the default landing page is fixed to the **Agency Dashboard**.
[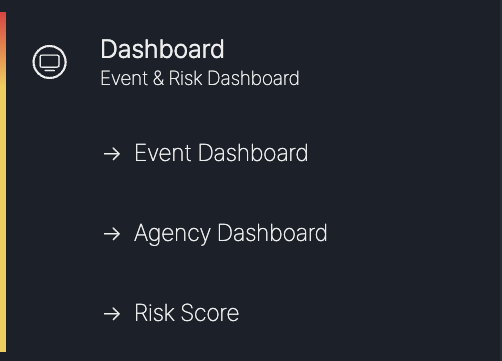](https://book.weetizen.com/uploads/images/gallery/2025-04/Bfqimage.png)
Currently, the dashboards are configured for the monitoring purposes of SKT’s agency SmartWAN system.
---
#### **Event Dashboard (under development)**
The Event Dashboard delivers aggregated information and status management insights for Incidents, Alerts, Threats, and other data collected from various data sources.
[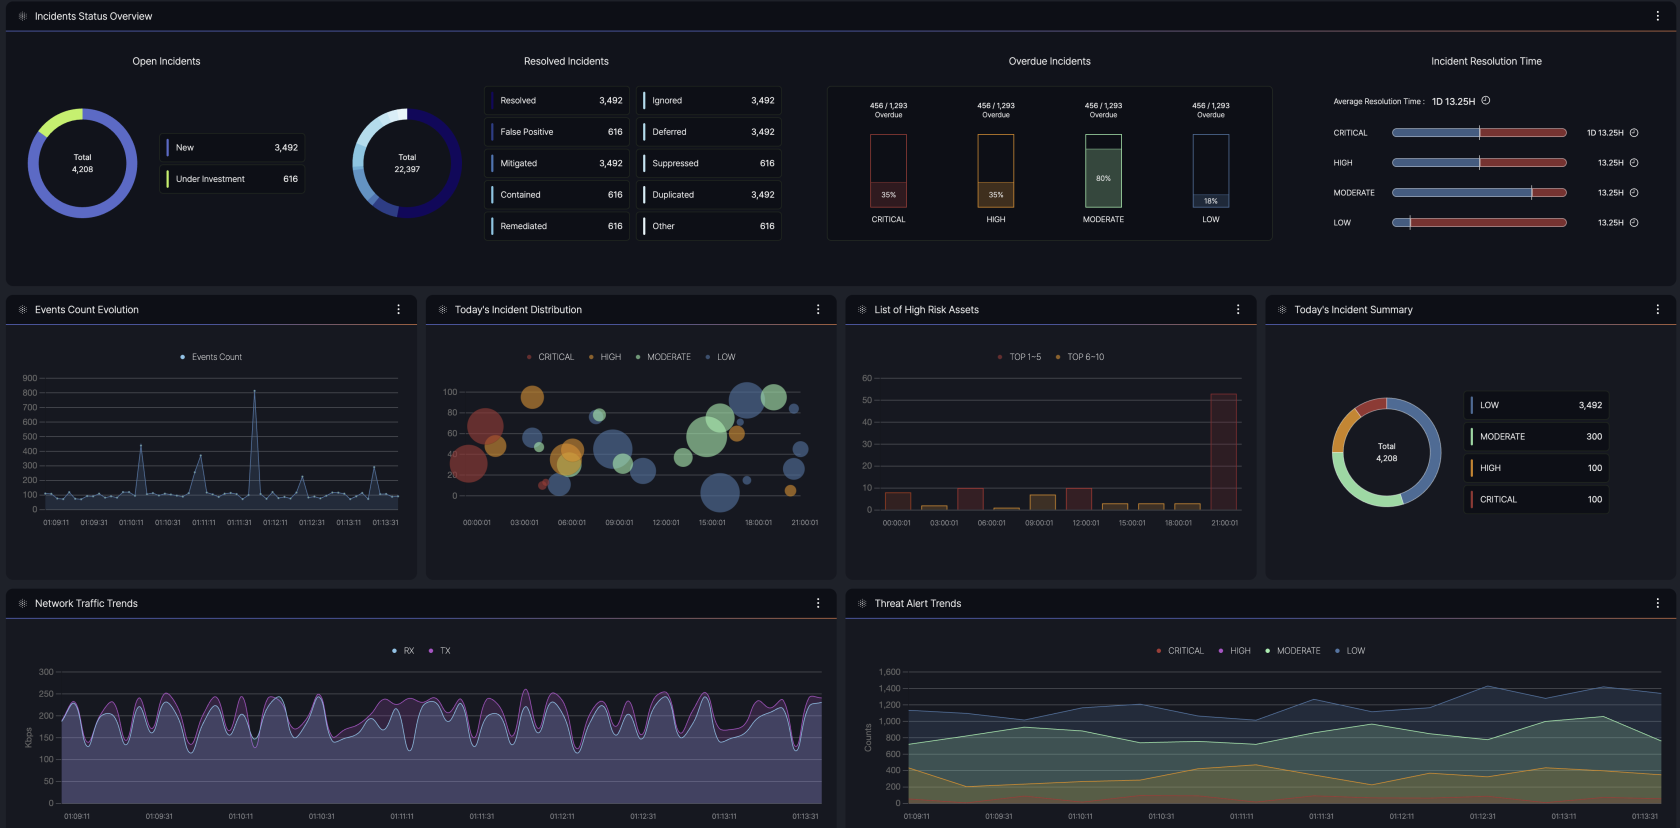](https://book.weetizen.com/uploads/images/gallery/2025-03/2025-03-30-5-33-21.png)
- **Purpose**: Provides a centralized view of security and network event data, enabling users to monitor and manage incidents effectively.
- **Data Sources**: Integrates information from multiple origins, including agents, agentless systems, and external feeds.
- **Key Information**: Displays summaries of event counts, severity levels, and current statuses to facilitate quick decision-making.
---
#### **Agency Dashboard**
The Agency Dashboard provides visualized status information on network and security events for agencies where SmartWAN CPE (Customer Premises Equipment) is installed, displayed through an interactive map interface.
There are 2 monitor dashboards
- Agency monitoring
- System monitoring
[](https://book.weetizen.com/uploads/images/gallery/2025-03/2025-03-30-7-21-07.png)
---
#### **Agency monitoring**
[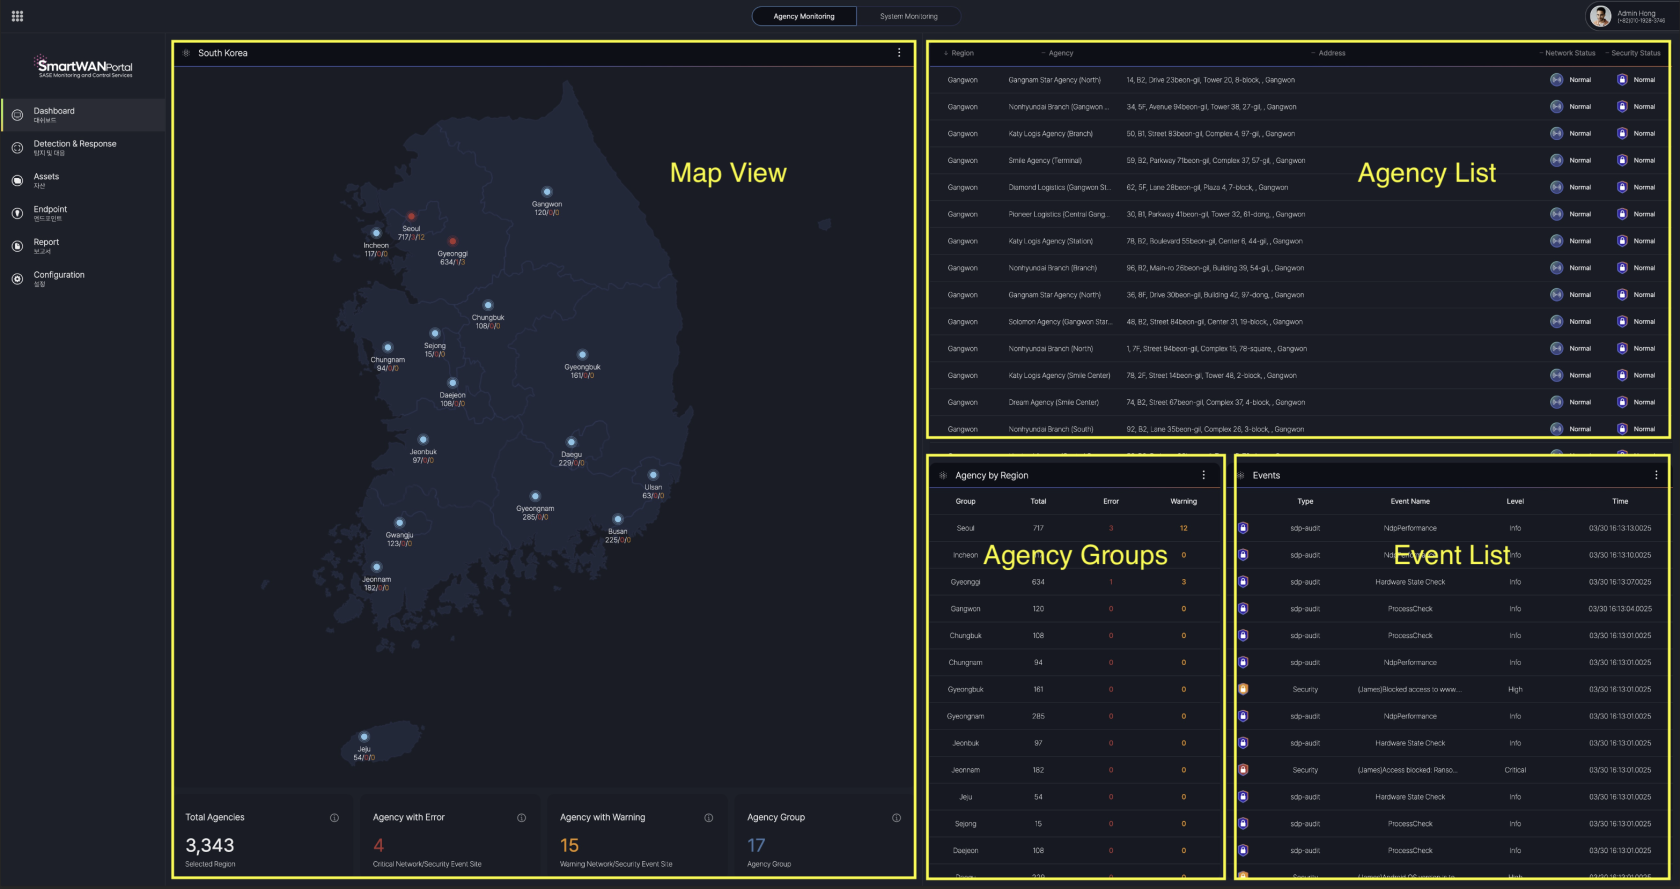](https://book.weetizen.com/uploads/images/gallery/2025-03/HSbimage.png)
##### **Map View**
[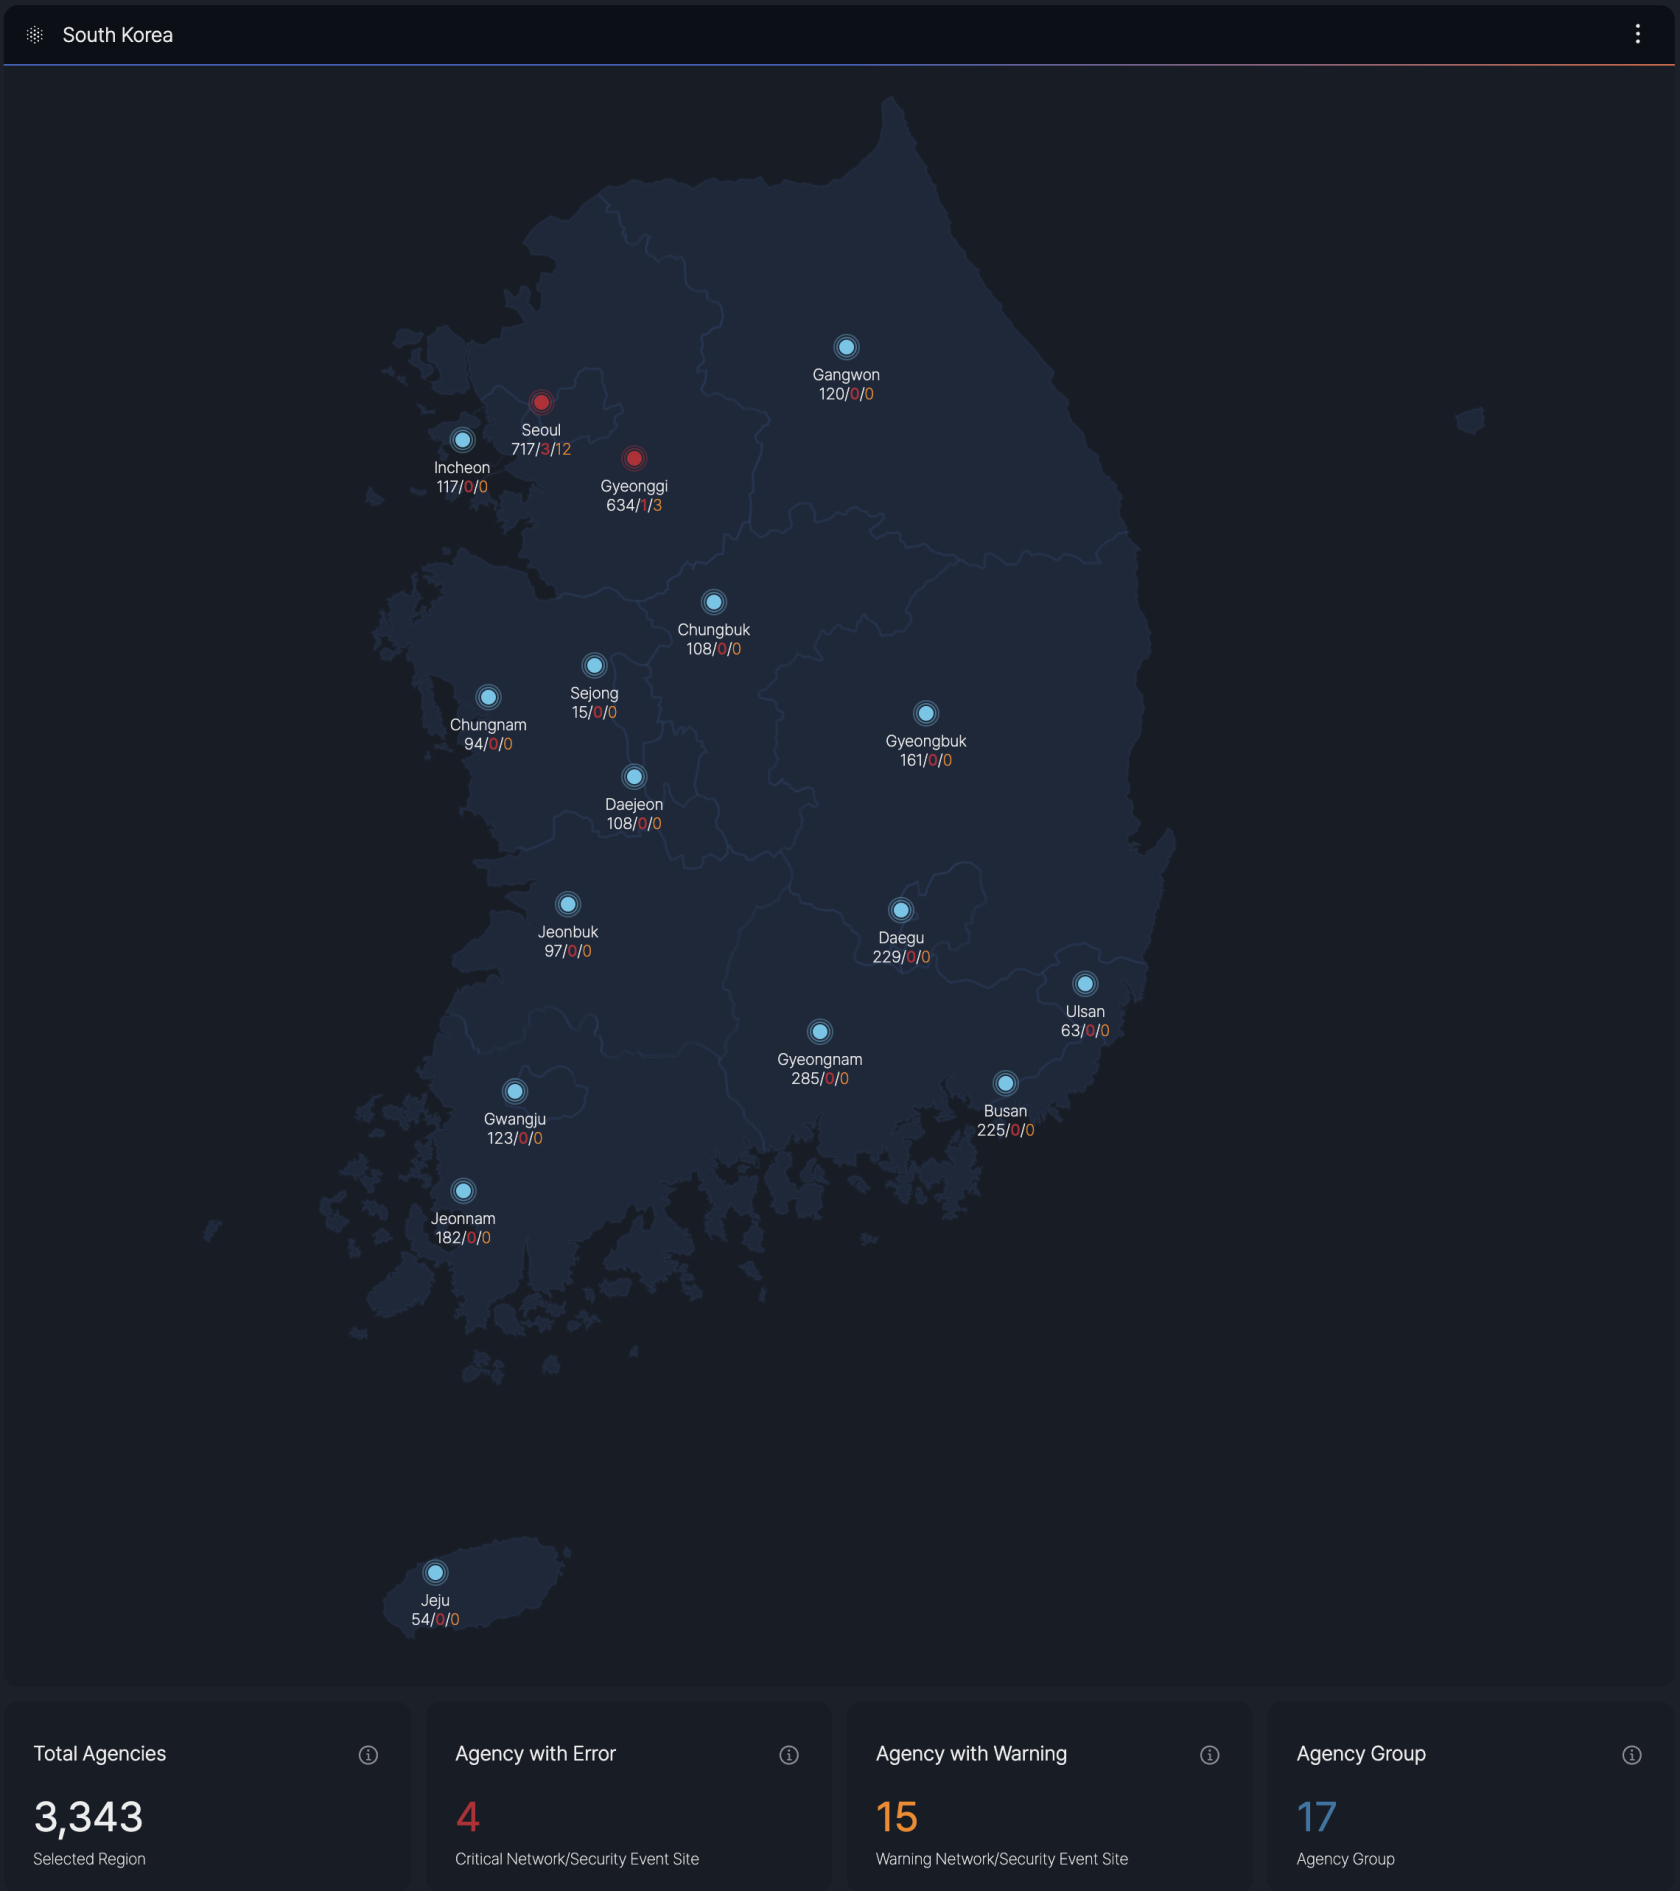](https://book.weetizen.com/uploads/images/gallery/2025-03/EJJimage.png)
This view offers a comprehensive overview of all agency locations and detailed information segmented by major cities. It aggregates and classifies network and security events into four categories. **Block**, **Critical**, **Minor**, and **Info**.
Event levels are defined by SKT's requirements.
##### **Agency List**
[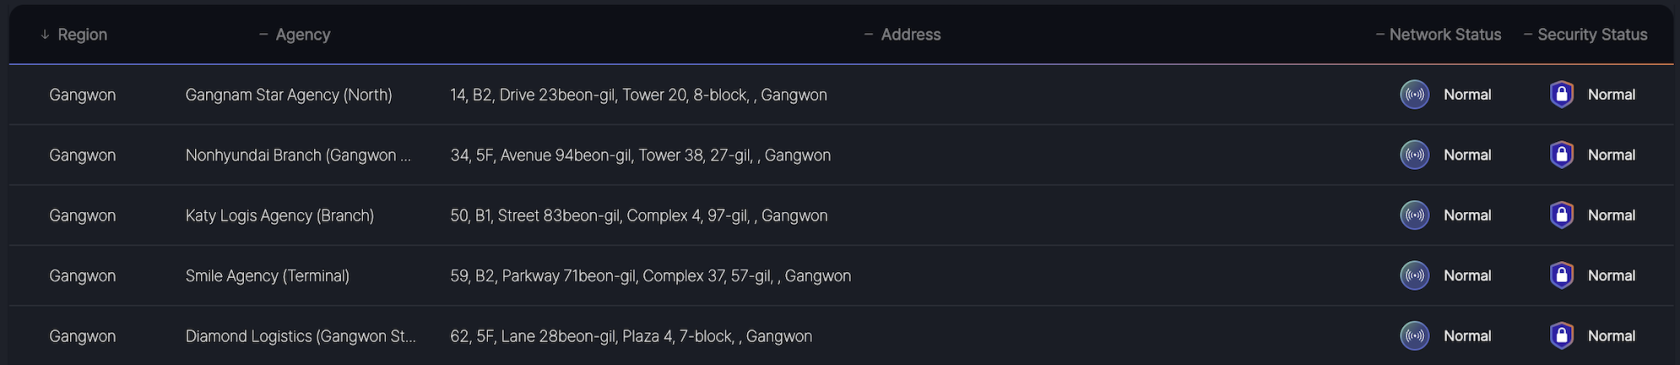](https://book.weetizen.com/uploads/images/gallery/2025-03/2025-03-30-8-20-03.png)
When a specific region is selected in the Map View, the dashboard displays a list of agencies registered in that region, along with detailed information on the **Network Status (CPE)** and **Security Status (SDP)** for each agency.
- **Agency List**: A comprehensive roster of agencies within the selected region.
- **Network Status (CPE)**: Provides the current operational status of the Customer Premises Equipment for eacßh agency.
- **Security Status (SDP)**: Details the security posture, including Software-Defined Perimeter (SDP) metrics, for each agency.
##### **View details of the agency**
To access an agency's detailed information:
1. Go to the **Agency List** in the dashboard
2. Click the desired **agency name**
3. The system will load the **detailed agency view**
**Network View**
This view provides a granular view of both network performance and security status for the selected agency. Users can toggle between Network View and Security View to access specific metrics.
[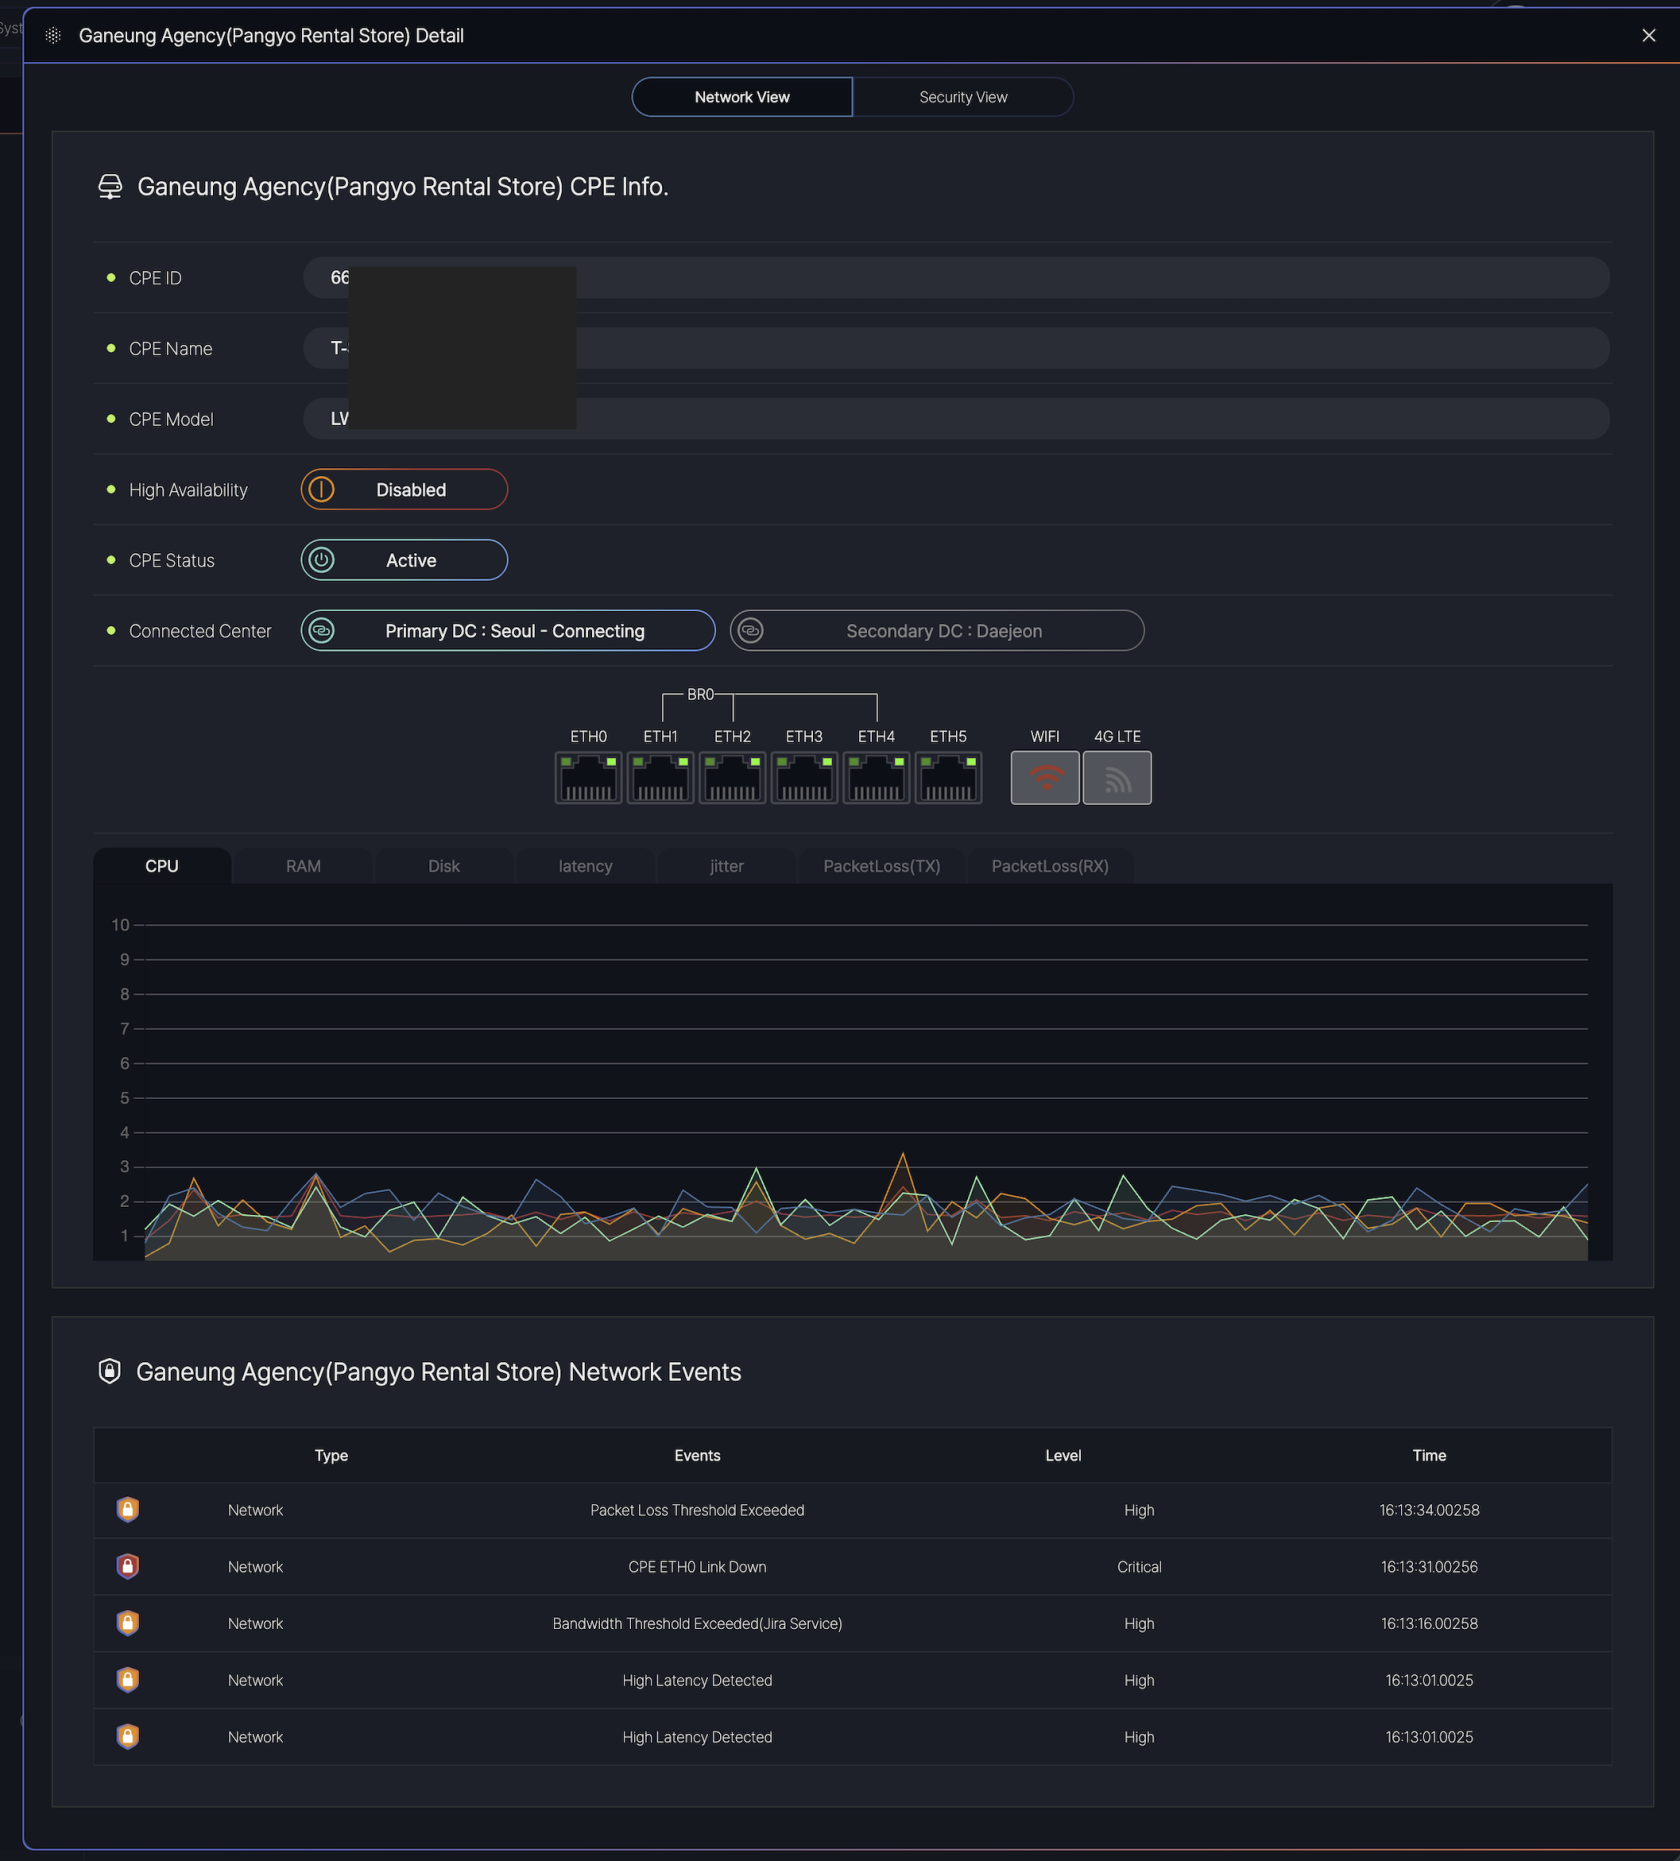](https://book.weetizen.com/uploads/images/gallery/2025-03/f7qimage.png)
The dashboard is divided into two main tabs:
- **Network View**: Displays real-time CPE status and network performance.
- **Security View**: Shows security-related alerts and SDP metrics (if applicable).
Displays hardware and connectivity details:
- **CPE ID/Name/Model**: Identifies the device.
- **High Availability**: Indicates redundancy status ( Enabled / Disabled).
- **CPE Status**:
- **Active**: Normal operation.
- **Degraded**: Performance issues detected.
- **Inactive**: Connection lost.
- **Connected Data Centers**: Primary (Seoul) and Secondary (Daejeon) links.
Network Performance Metrics data(Live) for troubleshooting:
- **CPU/RAM/Disk**: Resource usage (% or GB).
- **Latency/Jitter**: Measured in milliseconds (ms).
- **Packet Loss (TX/RX)**: Percentage of lost data packets.
Lists recent events with types and levels:
| **Column** | **Description** | **Example** |
|---|
| **Type** | Event category (Network/Security). | `Network` |
| **Event** | Description of the issue. | `CPE ETH0 Link Down` |
| **Level** | Severity: `Info`, `High`, `Critical`. | `Critical` |
| **Time** | Timestamp (HH:MM:SS.milliseconds). | `16:13:31.00256` |
**Security View**
This view provides comprehensive monitoring and management capabilities for the selected agency, displaying real-time network status, user information, security events, and service connectivity. The interface is divided into multiple sections for efficient administration.
[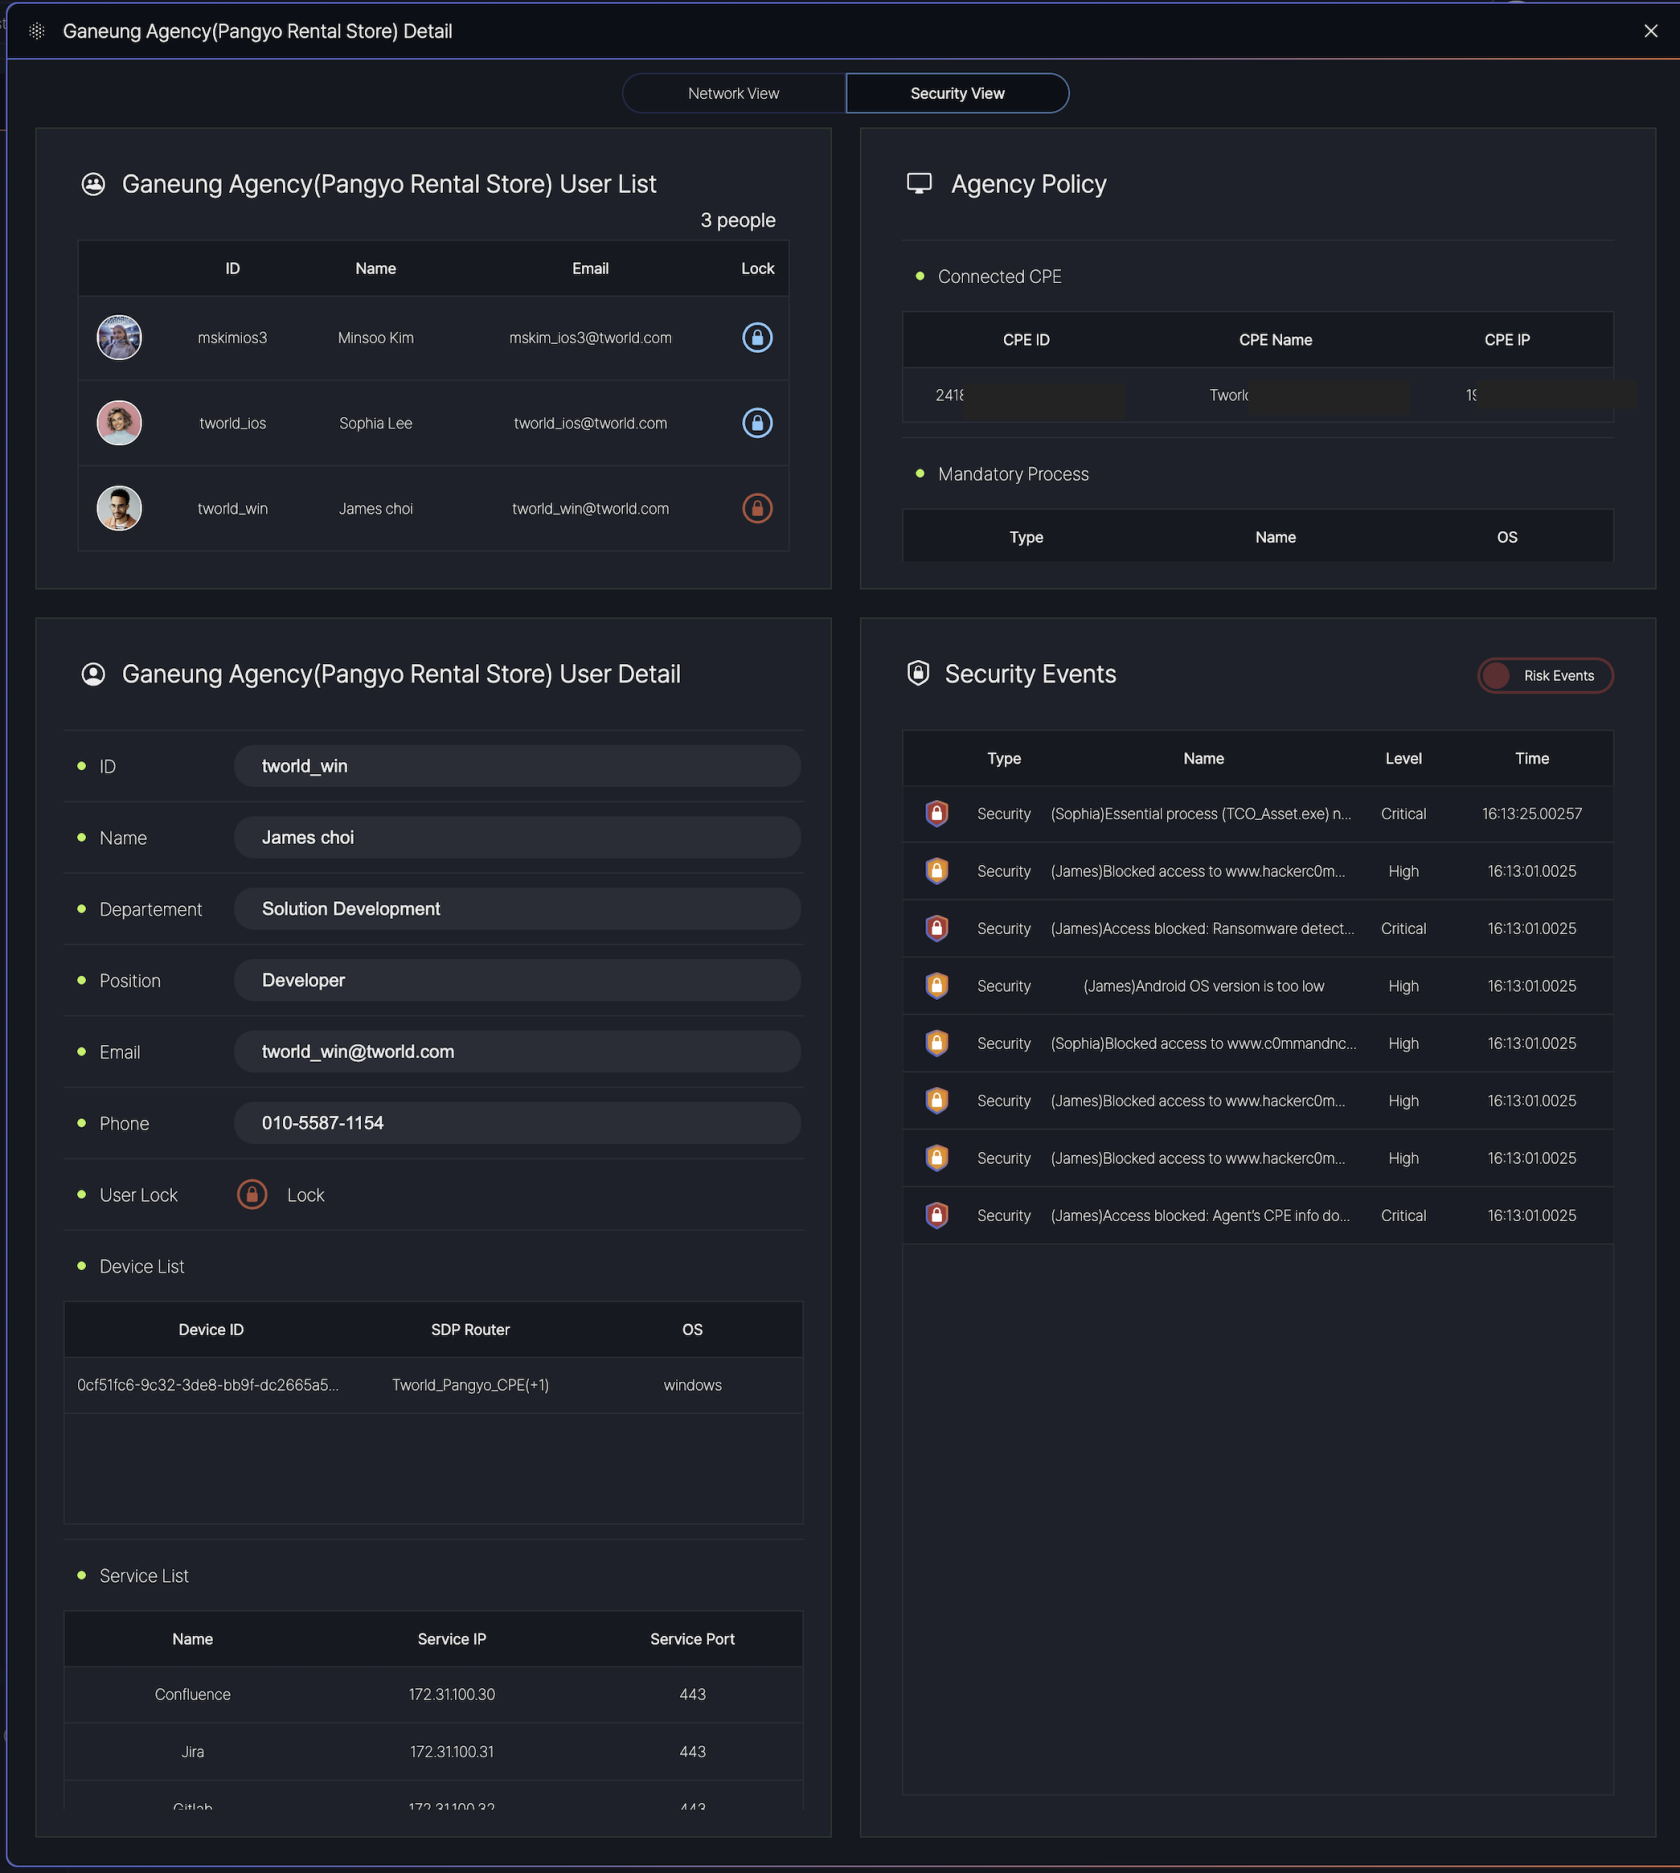](https://book.weetizen.com/uploads/images/gallery/2025-03/2025-03-30-8-21-48.png)
**User Management Section**
- User List
- Displays all registered users (currently **3 users**) with:
- **ID**: Unique user identifier (e.g., `mskimos3`)
- **Name**: Full name of the user (e.g., `Minsco.ftm`)
- **Email**: Associated email address (e.g., `mskim.ios8@tworld.com`)
- **Lock Status**: 💬 indicates an active session (no lock applied).
- User Detail
- Expands on selected user profiles with:
- **Department/Role**: Organizational hierarchy (e.g., `Solution Development > Developer`).
- **Contact**: Email (`tworld_win@tworld.com`) and phone (`010-5587-1154`).
- **Device List**: Managed devices linked to the user (e.g., `SDP Router` with OS details).
**Agency Policy & Configuration**
- **Connected CPE**
- Hardware details of the Customer Premises Equipment:
- **CPE ID/IP**: Unique identifiers for the network device.
- **CPE Name**: Label for easy recognition.
- **Mandatory Processes**
- Critical processes are monitored by type, name, and operating system.
**Security Monitoring**
- Security Events Table
- Lists real-time security incidents with:
- **Type/Name**: Event description (e.g., `Blocked access to ransomware sites`).
- **Level**: Severity (`Critical`, `High`).
- **Time**: Precise timestamp (e.g., `16:13:01.0025`).
- Example Events:
- `Critical`: Ransomware detection, essential process violations.
- `High`: Blocked access to malicious domains, outdated OS alerts.
##### **Agency Groups**
[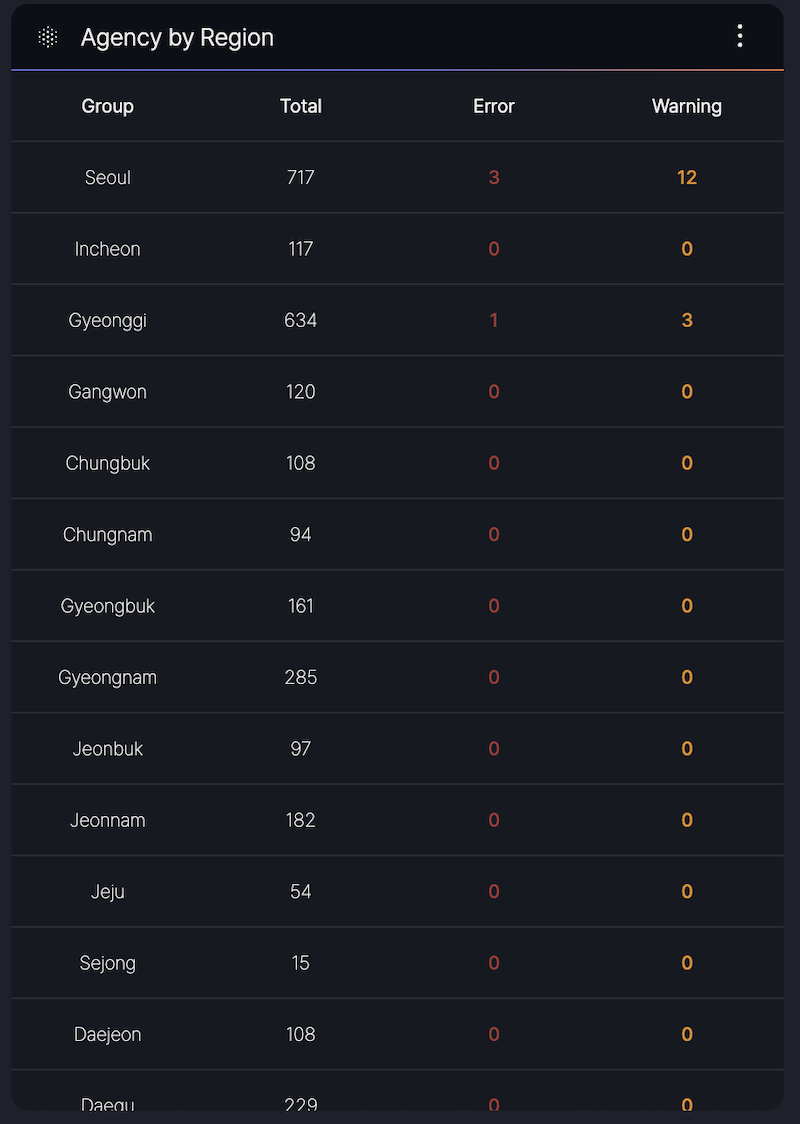](https://book.weetizen.com/uploads/images/gallery/2025-03/2025-03-30-7-32-12.png)
The Agency Group section provides a summary of agency counts per region and detailed status information for CPE.
- **Region-Based Counts**: Displays the total number of agencies in each region.
- **CPE Status Info**: Offers insights into the operational status of CPE devices across the agencies
##### **Event List**
[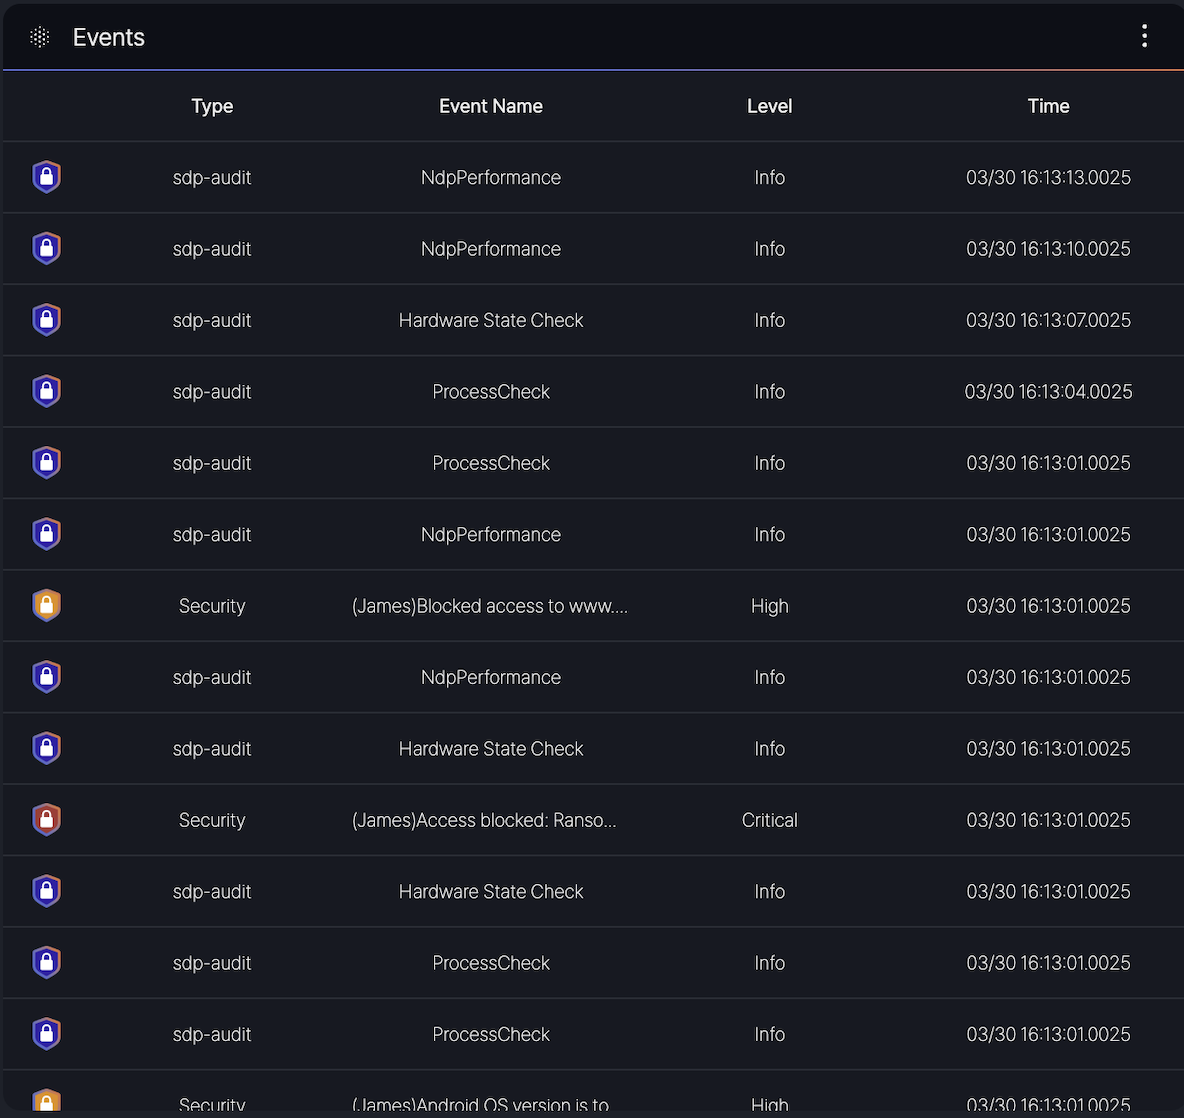](https://book.weetizen.com/uploads/images/gallery/2025-03/2025-03-30-7-39-42.png)
The Event List section displays a table of recent events, providing detailed information including the event type, name, severity level, and timestamp for all recorded incidents.
**Columns**: - **Type**: Indicates the category of the event (e.g., sdp-audit, Security).
- **Event Name**: Specifies the event description (e.g., NdpPerformance, Hardware State Check, ProcessCheck, or security-related messages like \[JAMES\] Blocked access to www…).
- **Level**: Denotes the severity of the event, categorized as Info, Minor, or Critical, Block.
- **Time**: Shows the timestamp of the event in the format MM/DD HH:MM:SS.milliseconds (e.g., 03/30 16:13:00.025).
**Examples**: - sdp-audit events such as NdpPerformance and Hardware State Check with Info level.
- Security events like \[JAMES\] Access blocked: Rans… with Critical level or \[JAMES\] Android OS version is to… with High level.
---
#### **System monitoring**
[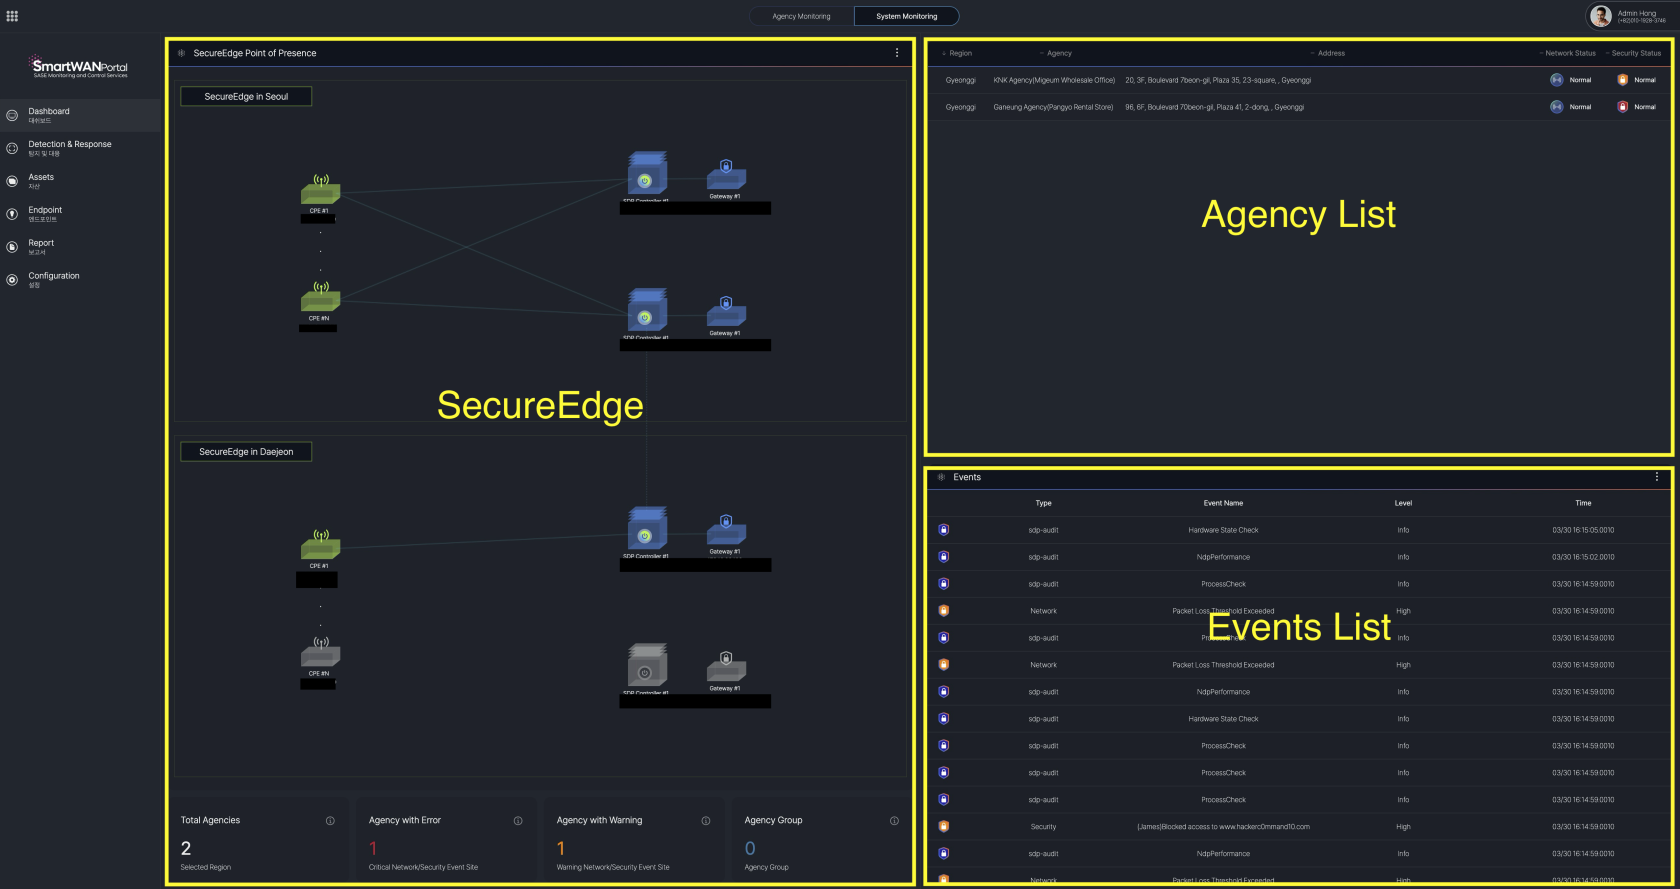](https://book.weetizen.com/uploads/images/gallery/2025-03/8bgimage.png)
##### **SecureEdge point of presence**
[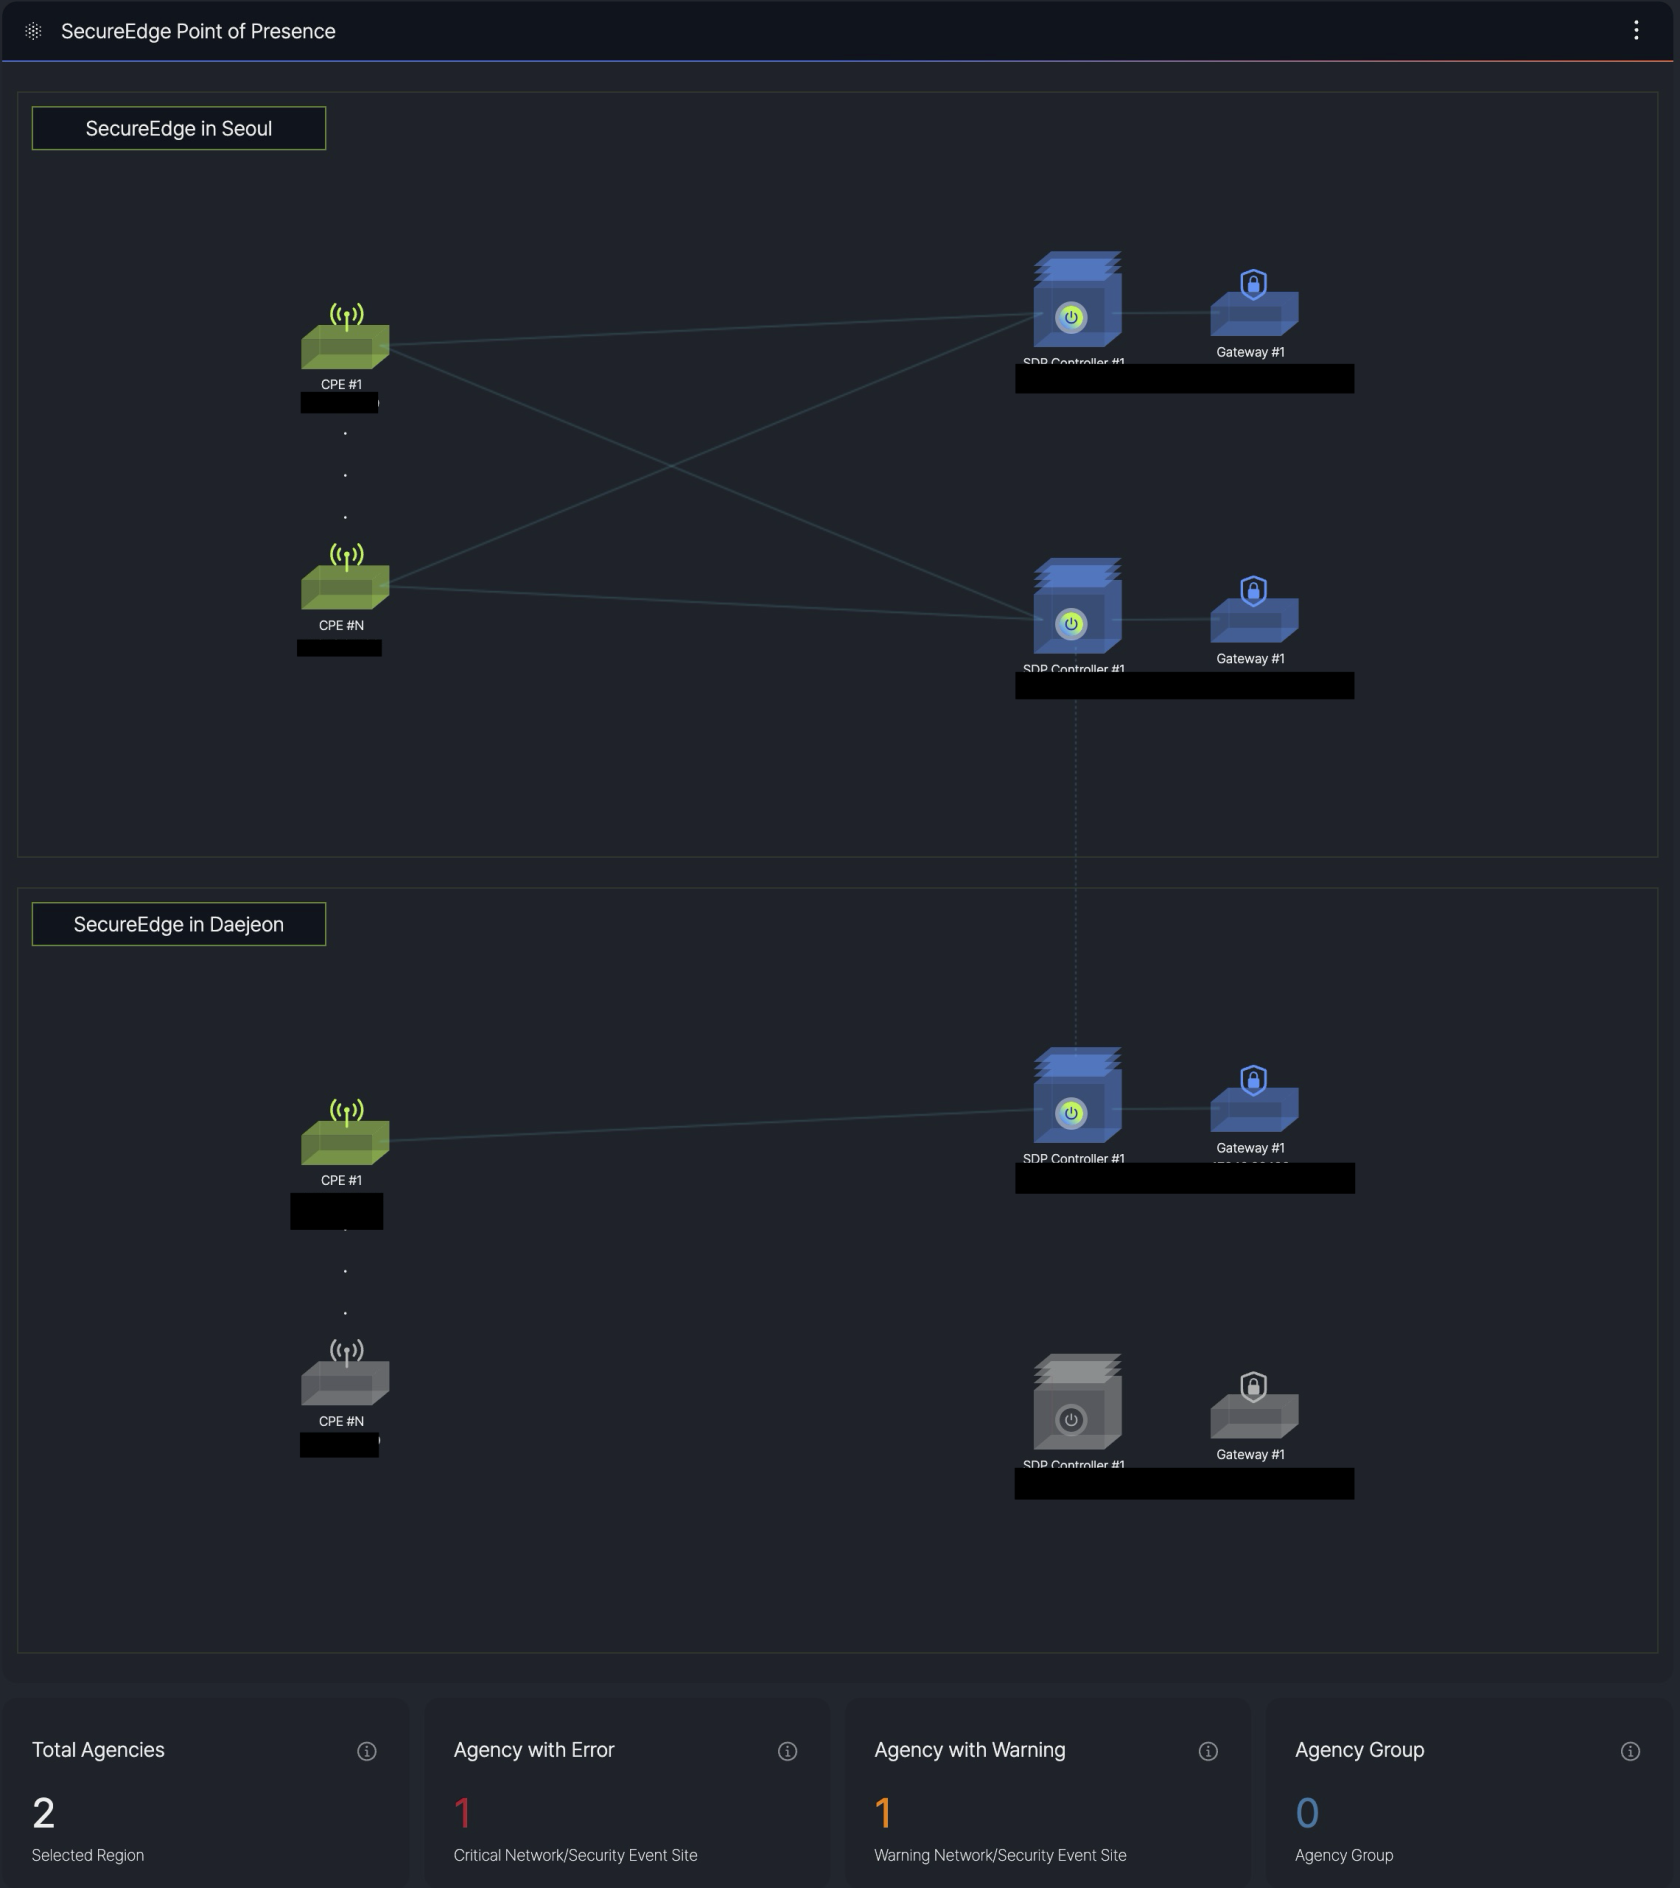](https://book.weetizen.com/uploads/images/gallery/2025-03/I6aimage.png)
It shows SecureEdge's distributed architecture. The visual indicators show system statuses, and on the bottom, highlight critical/security events of the agency.
This monitoring supports SKT's internal operations only, providing real-time monitoring of their SecureEdge deployment through redundant controllers and gateways at each location.
##### **Agency List**
It's the same as the **agency list** in **Agency Monitoring.**
##### **Events List**
It's the same as the **events list** in **Agency Monitoring.**
---
#### **Risk Scoring (under development)**
This dashboard provides a consolidated view of **network security compliance, threat protection status, and regulatory adherence** for monitoring and reporting purposes.
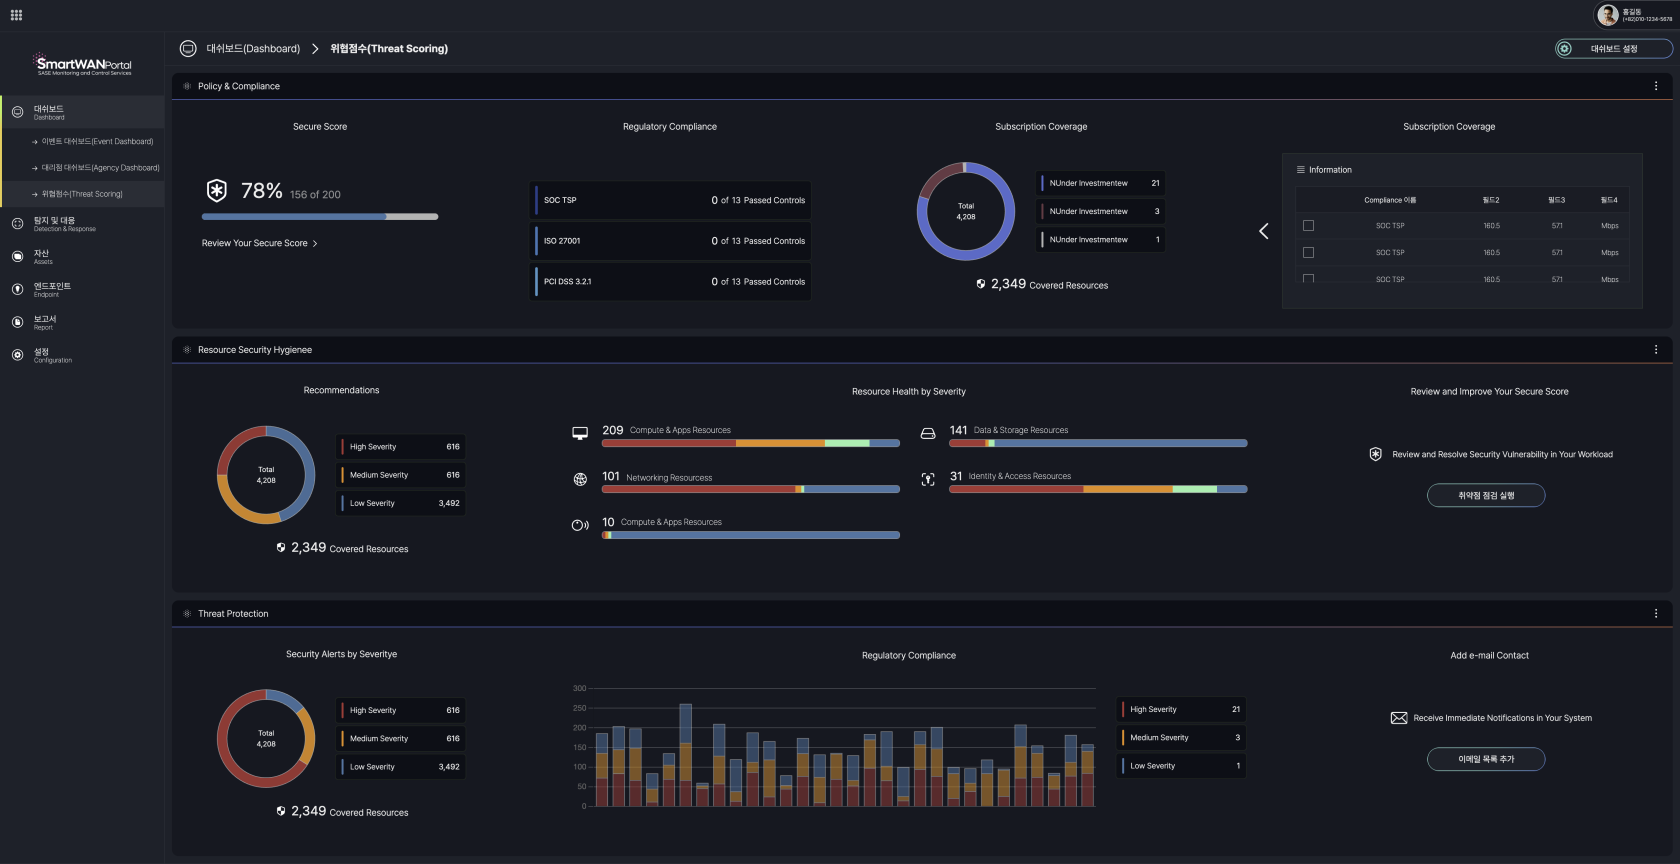
The current visualization serves as a prototype. We will develop optimized data representation formats aligned with operational objectives during the implementation phase.
# Detection & Response
#### **Cases**
The user can access the **cases menu**, which is under **Detection & Response.**
#### **Case List**
The **Case List** screen in the SmartWAN Portal, accessible under the "Detection & Response" section, provides a detailed list of cases generated by analyzing event logs. This screen allows users to view and manage security and network-related incidents efficiently.
[](https://book.weetizen.com/uploads/images/gallery/2025-04/yyOimage.png)
##### **Key Features**
- **Filters and Search**:
- **Customer and Asset Selection**: Dropdown menus at the top (e.g., "Select a customer," "Select an asset") to filter cases by specific customers or assets.
- **Date Range**: A date picker to filter cases within a specific time period (e.g., 2024/09/30 - 2024/10/30).
- **Advanced Search**: A button on the right to access advanced search options for more granular filtering.
- **Case Summary**:
- Displays the total number of cases (e.g., 279 cases) and the total results (e.g., 2,193 cases) for the selected filters.
- **Case Table**:
- A table listing cases with columns such as:
- **Event Type**: Type of event (e.g., Raw Packet).
- **Source Asset**: Source of the event.
- **Destination Asset**: Destination of the event.
- **Rule**: Applied rule.
- **Source IP**: Source IP address.
- **Destination Port**: Destination port.
- **Time**: Timestamp of the event.
- **Raw Packet**: A column with a clickable icon to view raw packet details (e.g., BSX525D9252F...).
- **Notification Settings**:
- A "Notification Settings" button at the top-right corner to configure alert preferences.
The items provided in the Case List may be modified in the future based on evolving requirements.
##### **Case Filtering**
[](https://book.weetizen.com/uploads/images/gallery/2025-04/zpdimage.png)
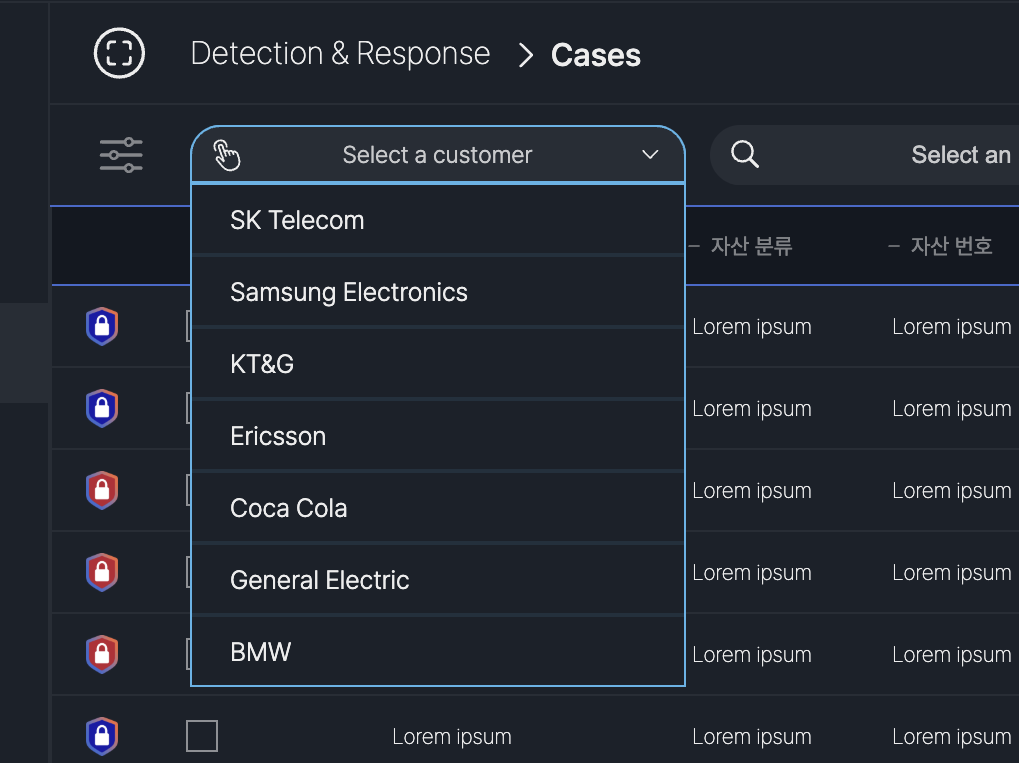
*After selecting a customer, the case table updates to reflect cases specific to that customer, ensuring users can focus on relevant incidents.*
**Customer Selection**: - **Dropdown Menu**: Displays a list of available customers (e.g., SK Telecom, Samsung Electronics, KT&G, Ericsson, Coca Cola, General Electric, BMW).
- **Action**: Click the "Select a customer" dropdown to choose a customer, filtering the case list to show only cases related to the selected customer.
**Multi-Tenant Support**: - Each customer is represented, indicating secure separation of data in the multi-tenant environment.
- The associated assets for the selected customer are displayed.
[](https://book.weetizen.com/uploads/images/gallery/2025-04/r8dimage.png)
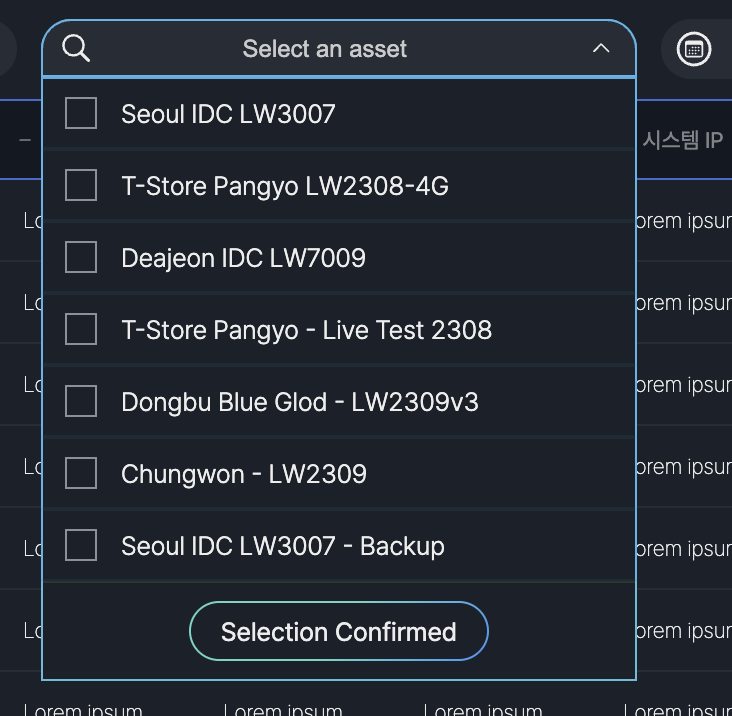
*The **Select an Asset** dropdown on the **Case List** screen allows users to filter cases by specific assets. It lists assets such as "Seoul IDC LW3007," "T-Store Pangyo LW2308-4G," and "Daejeon IDC LW7009." Users can select an asset and click "Selection Confirmed" to update the case list.*
[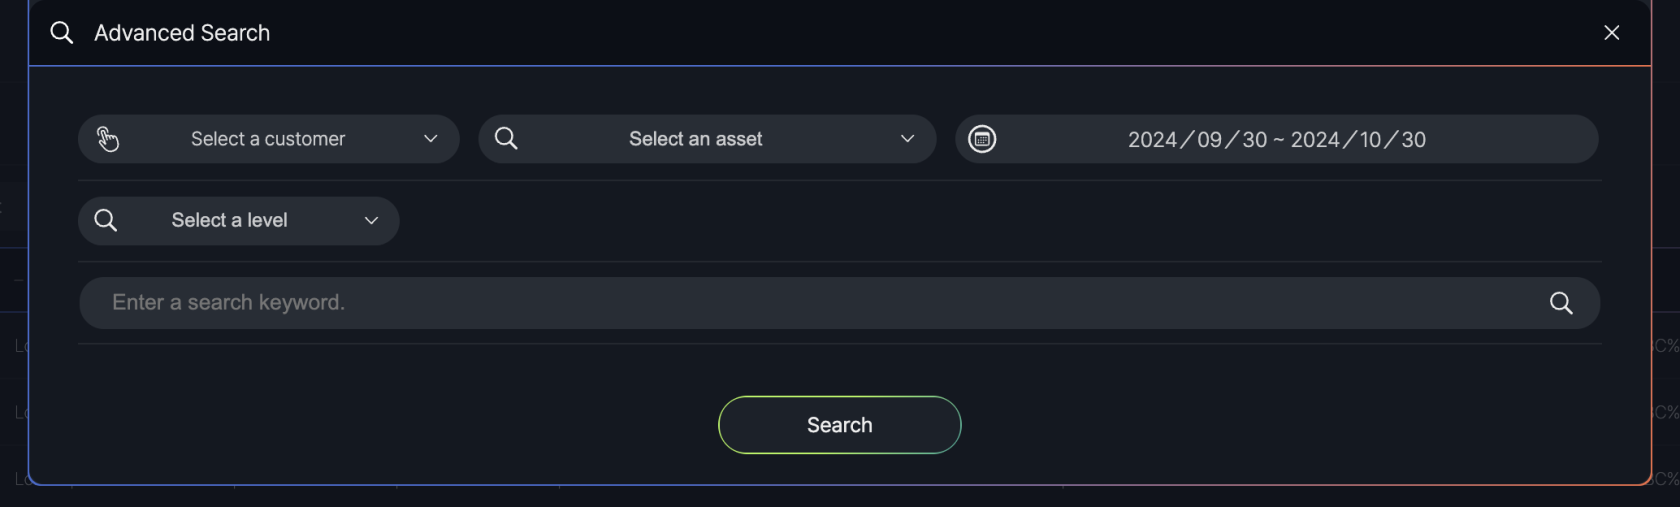](https://book.weetizen.com/uploads/images/gallery/2025-04/3Zgimage.png)
*The **Advanced Search** feature on the **Case List** screen allows users to refine their case search with additional filters. Accessible via the "Advanced Search" button, it includes options to select a customer, asset, severity level (e.g., Critical, High), and enter a search keyword. Users can apply these filters by clicking the "Search" button to update the case list.*
#### **Case Details**
The **Case Details** popup in the SmartWAN Portal is displayed when a user selects a case from the **Case List** screen. This popup provides detailed information about the selected case, including event specifics and related events, to assist users in analyzing and managing.
- **Case Information**: The default tab, showing detailed case data.
- **Case Management**: A secondary tab for managing the case.
##### **Case Information**
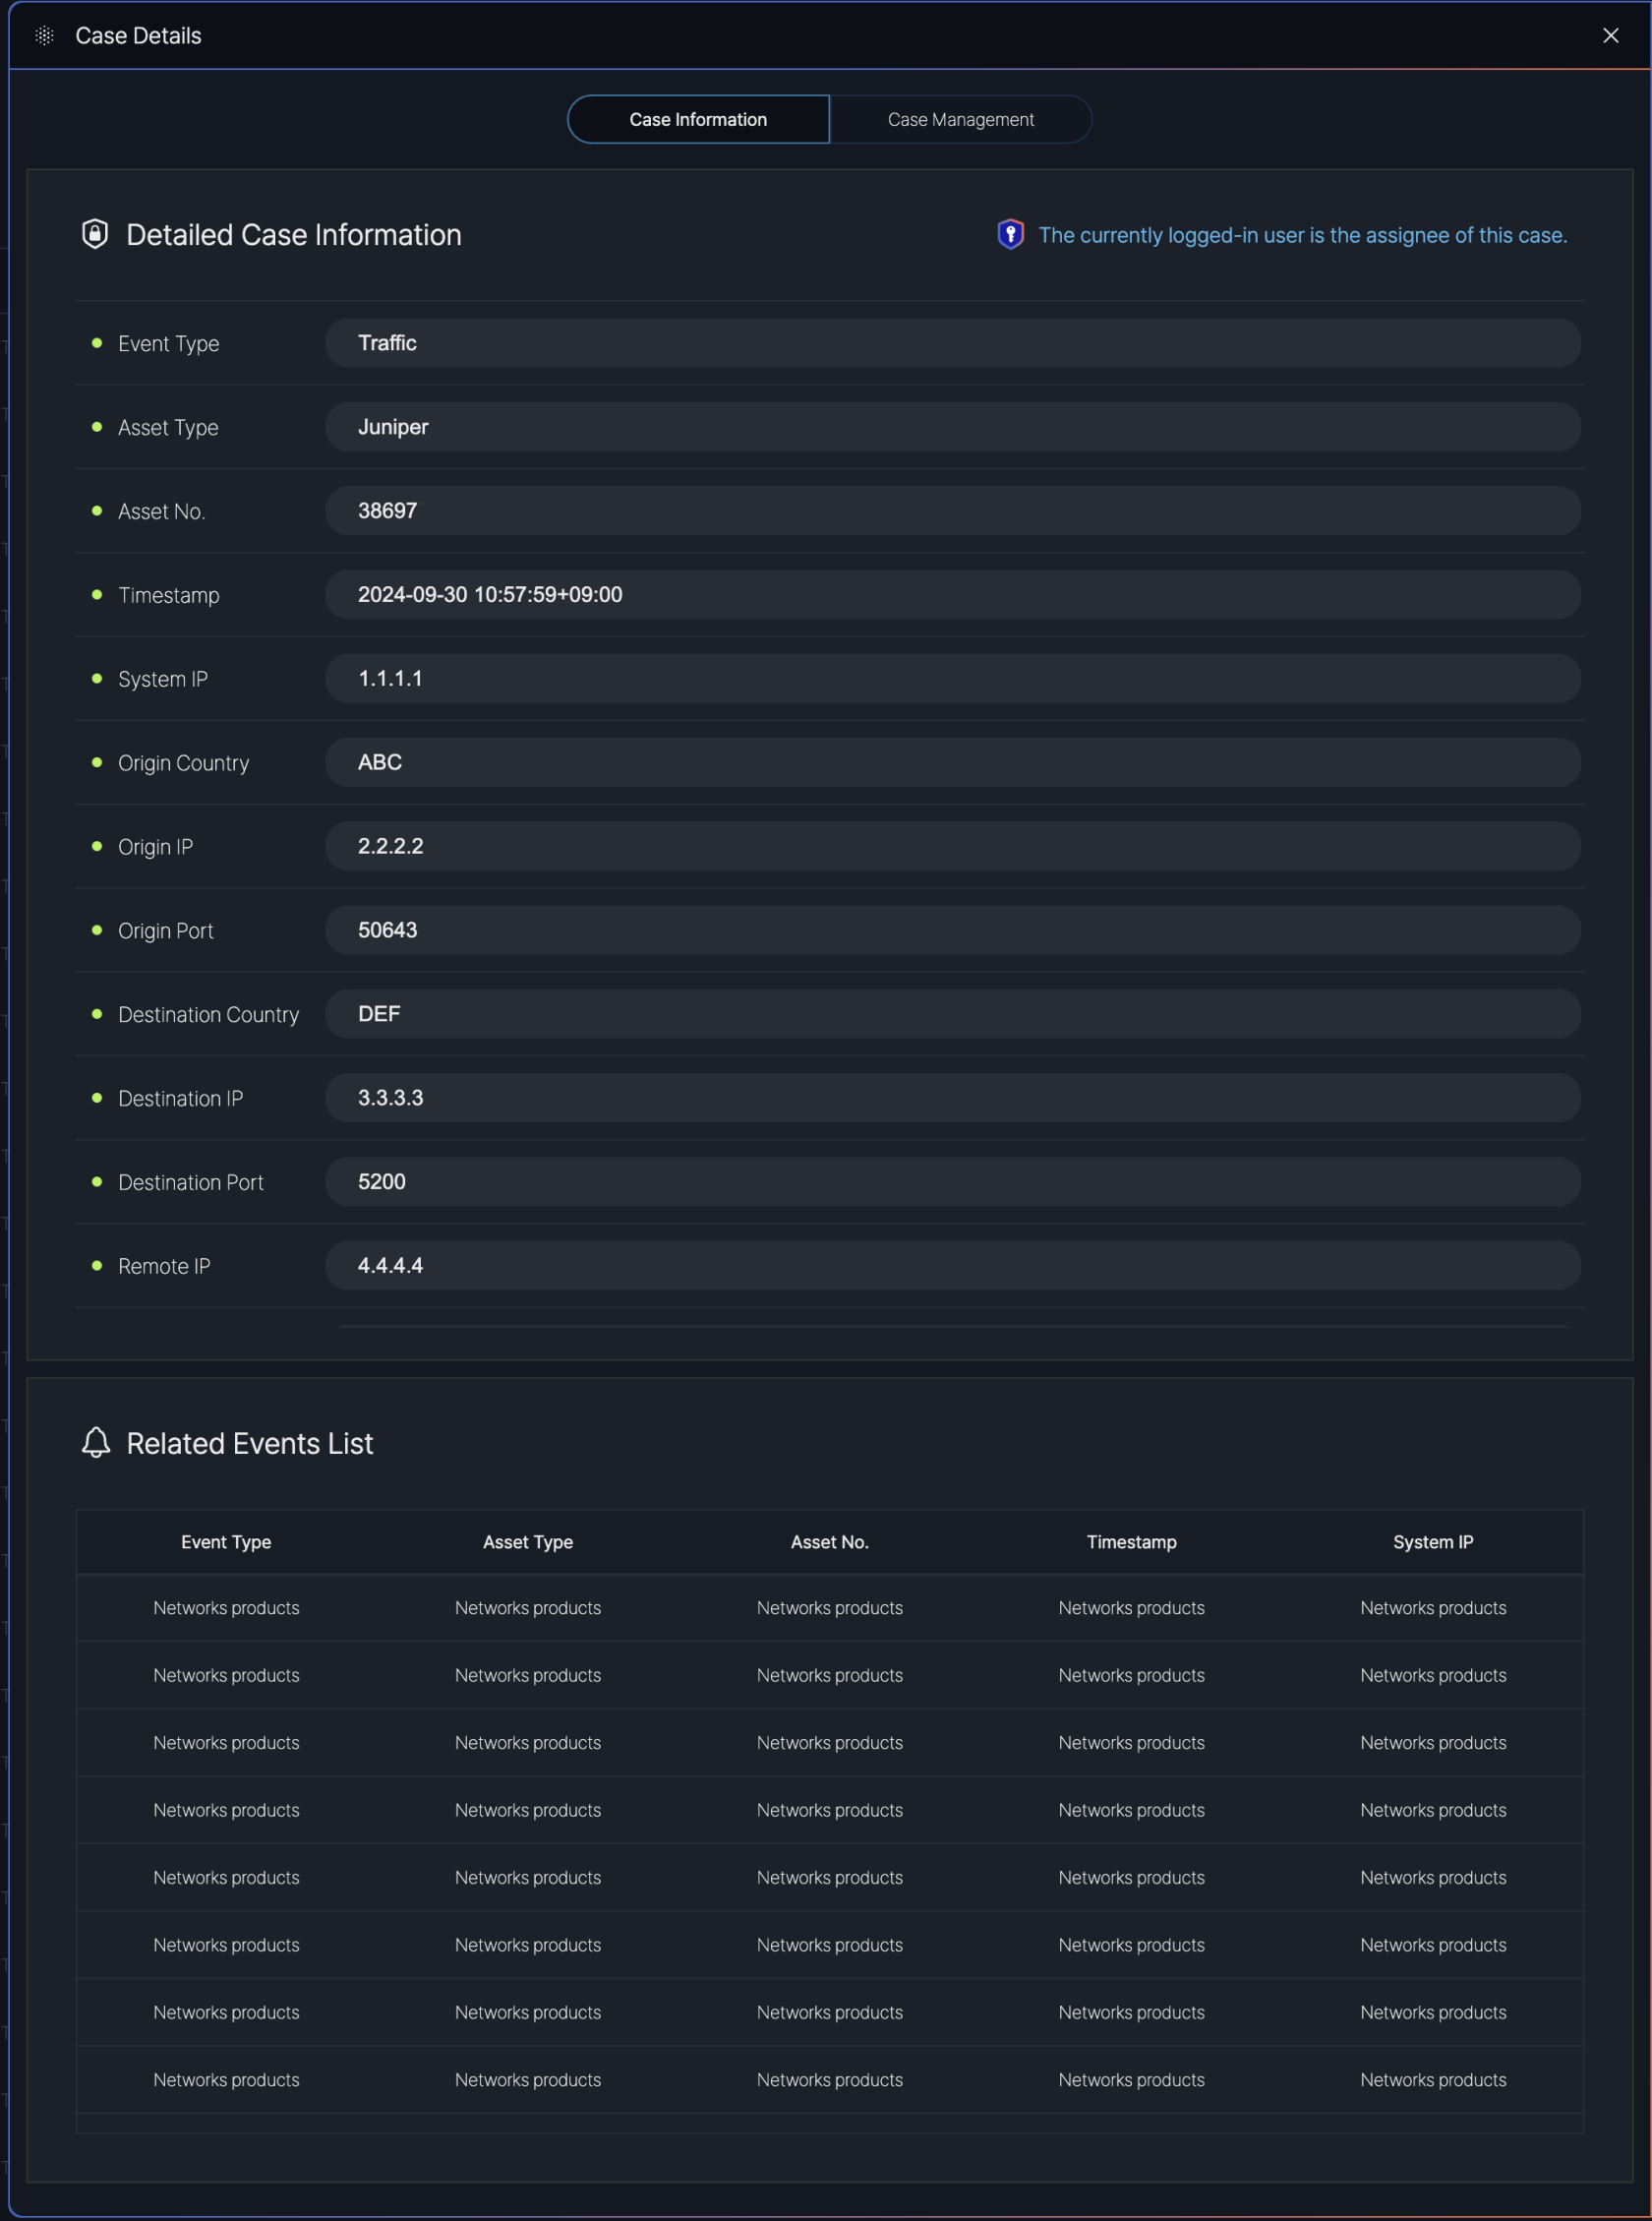
**Detailed Case Information**: - **Event Type**: The type of event
- **Asset Type**: The type of asset involved
- **Asset No.**: The asset identifier
- **Timestamp**: The date and time of the event
- **System IP**: The system IP address
- **Origin Country**: The country of origin
- **Origin IP**: The originating IP address
- **Origin Port**: The originating port
- **Destination Country**: The destination country
- **Destination IP**: The destination IP address (
- **Destination Port**: The destination port
- **Remote IP**: The remote IP address
**Related Events List**: - A table at the bottom listing related events, with columns including:
- **Event Type**: Type of related event
- **Asset Type**: Type of asset involved
- **Asset No.**: Asset identifier
- **Timestamp**: Date and time of the related event
- **System IP**: System IP address
#### **Case Management**
The **Case Management** tab in the **Case Details** popup outlines the steps for handling a case in the SmartWAN Portal.
The procedures guide users through the process of managing a case from opening to closure. Below is a summary of the steps involved.
**Case Management Procedure Table**
| Step | Procedure | Description |
|---|
| 1 | Case Open | Initiates the case and assigns it to a user. |
| 2 | Initial Investigation | Conducts preliminary analysis of the incident. |
| 3 | Prioritization | Assigns a priority level to the case. |
| 4 | Analysis and Response | Performs detailed analysis and responds to the incident. |
| 5 | Containment and Mitigation | Implements measures to contain and mitigate the issue. |
| 6 | Recovery and Remediation | Restores systems and applies fixes to prevent recurrence. |
| 7 | Case Closure | Closes the case after resolution. |
| 8 | Post-Incident Review | Reviews the incident for lessons learned. |
**Purpose**: The "Case Open" step marks the beginning of the case management process. When a case is identified (e.g., a traffic-related event on a Juniper asset), it is opened in the system, and relevant details are recorded.
**Details Displayed**: - **Assignee**: The user assigned to handle the case (e.g., Bryan Ga).
- **Event Type**: The type of event (e.g., Traffic).
- **Asset Type**: The type of asset involved (e.g., Juniper).
- **Asset No.**: The asset identifier (e.g., 38697).
- **Timestamp**: The date and time the event occurred (e.g., 2024-09-30 10:57:59+09:00).
- **System IP**: The system IP address (e.g., 1.1.1.1).
- **Severity Level**: The severity of the case (e.g., Critical).
- **Threat Classification**: The threat level or classification (e.g., 9)
##### **Step 2. Initial Investigation**
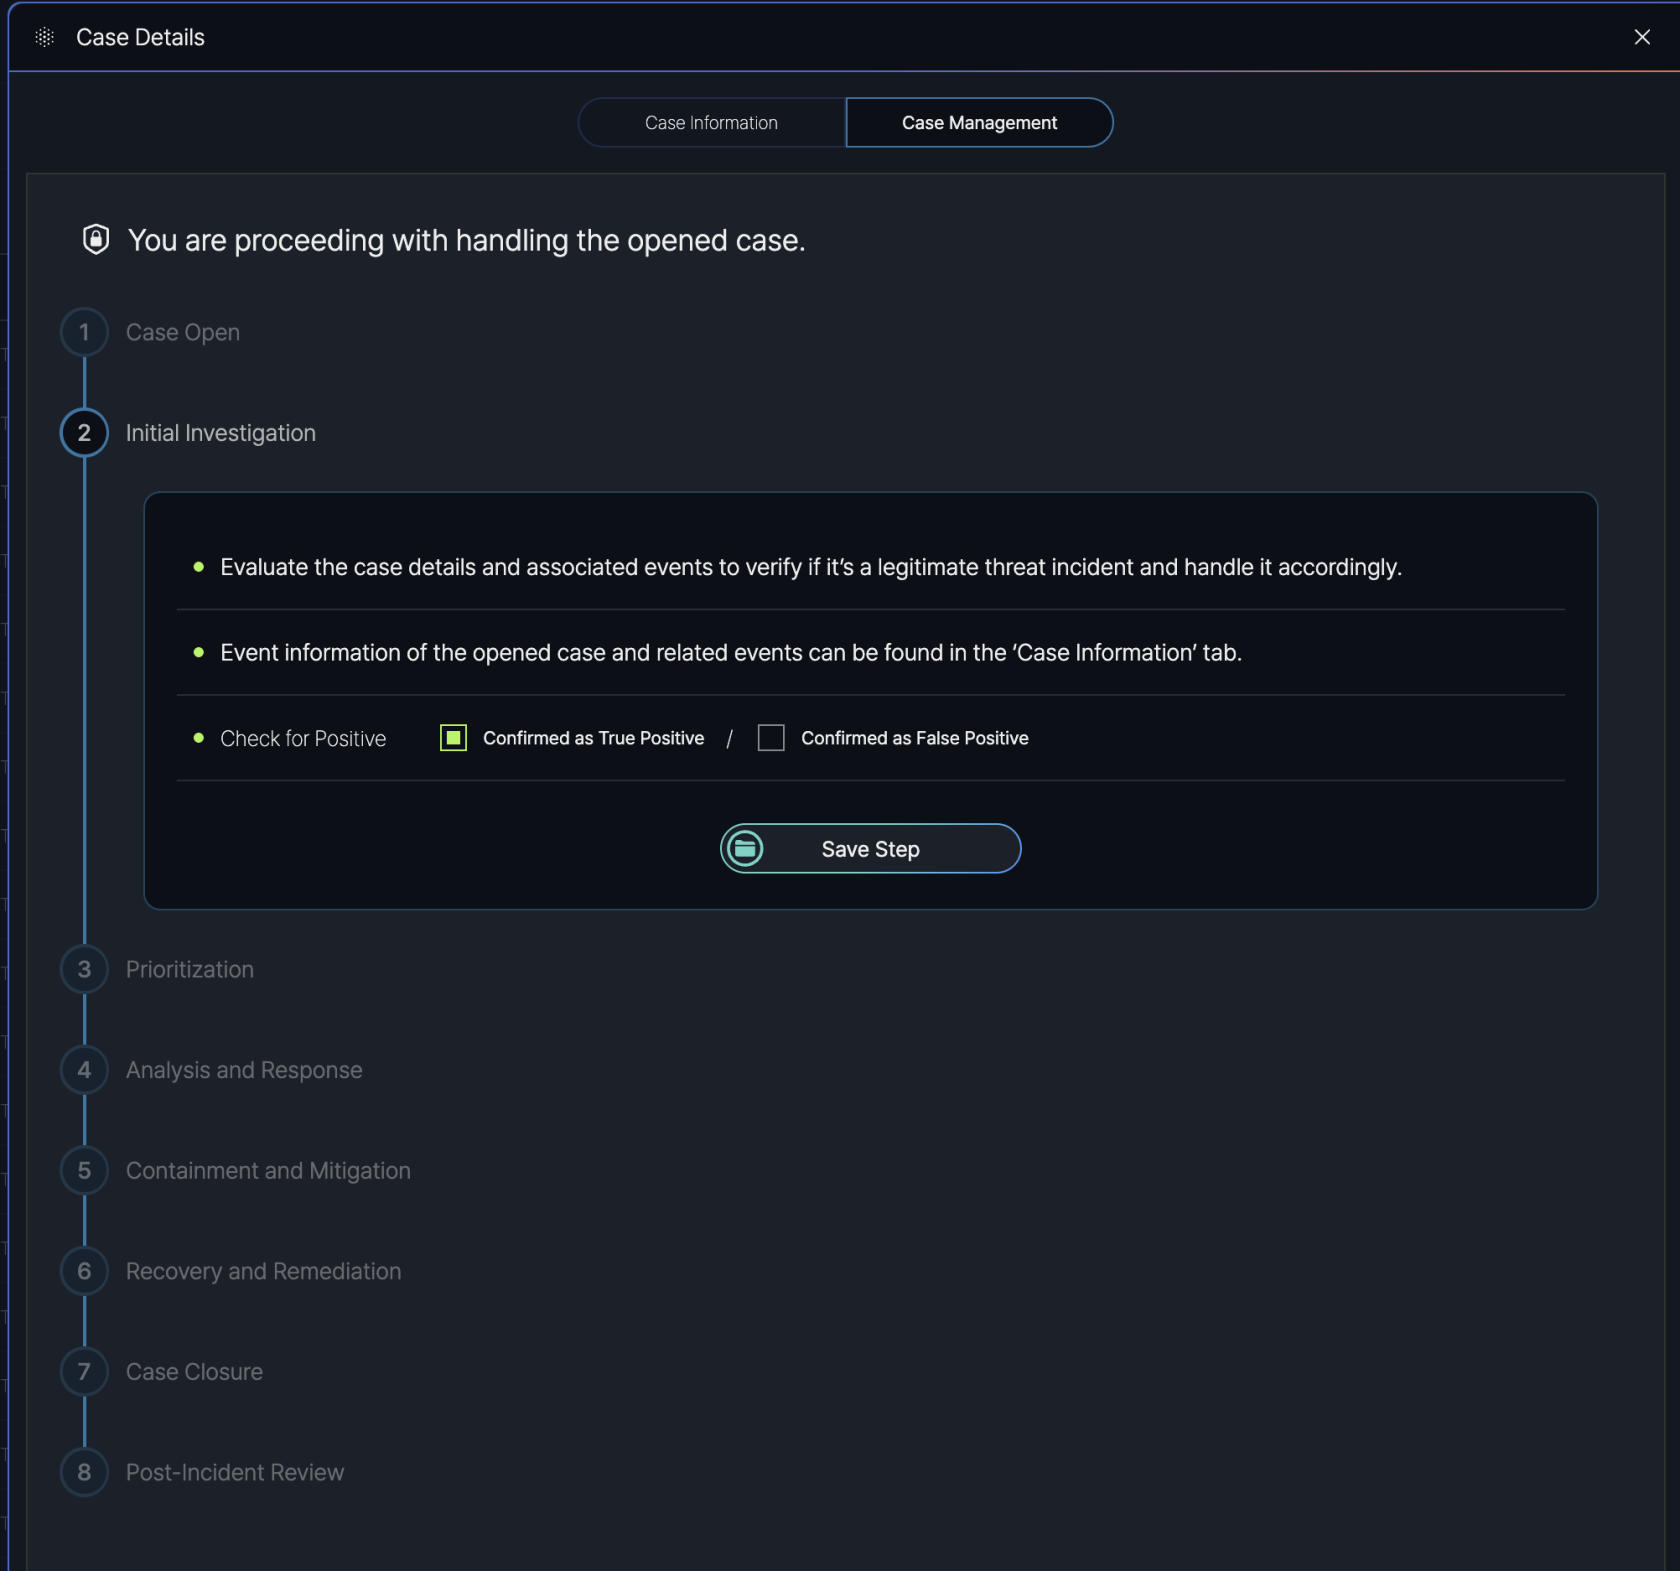
**Purpose**: The "Initial Investigation" step involves evaluating the case details and associated events to confirm whether the incident is a legitimate threat that requires further action.
**Instructions Provided**: - **Evaluate the Case**: Users are prompted to "Evaluate the case details and associated events to verify if it’s a legitimate threat incident and handle it accordingly."
- **Event Information Access**: Users can find detailed event information for the open case and related events in the "Case Information" tab of the **Case Details** popup.
- **Check for Positive**: Users must determine the legitimacy of the threat by selecting one of two options:
- **Confirmed as True Positive**: Indicates the incident is a confirmed threat.
- **Confirmed as False Positive**: Indicates the incident is not a threat (e.g., a false alarm).
**Action**: - After completing the evaluation and selecting the appropriate "Check for Positive" option, users click the "Save Step" button to record their findings and proceed to the next step in the Case Management process.
##### **Step 3. Prioritization**
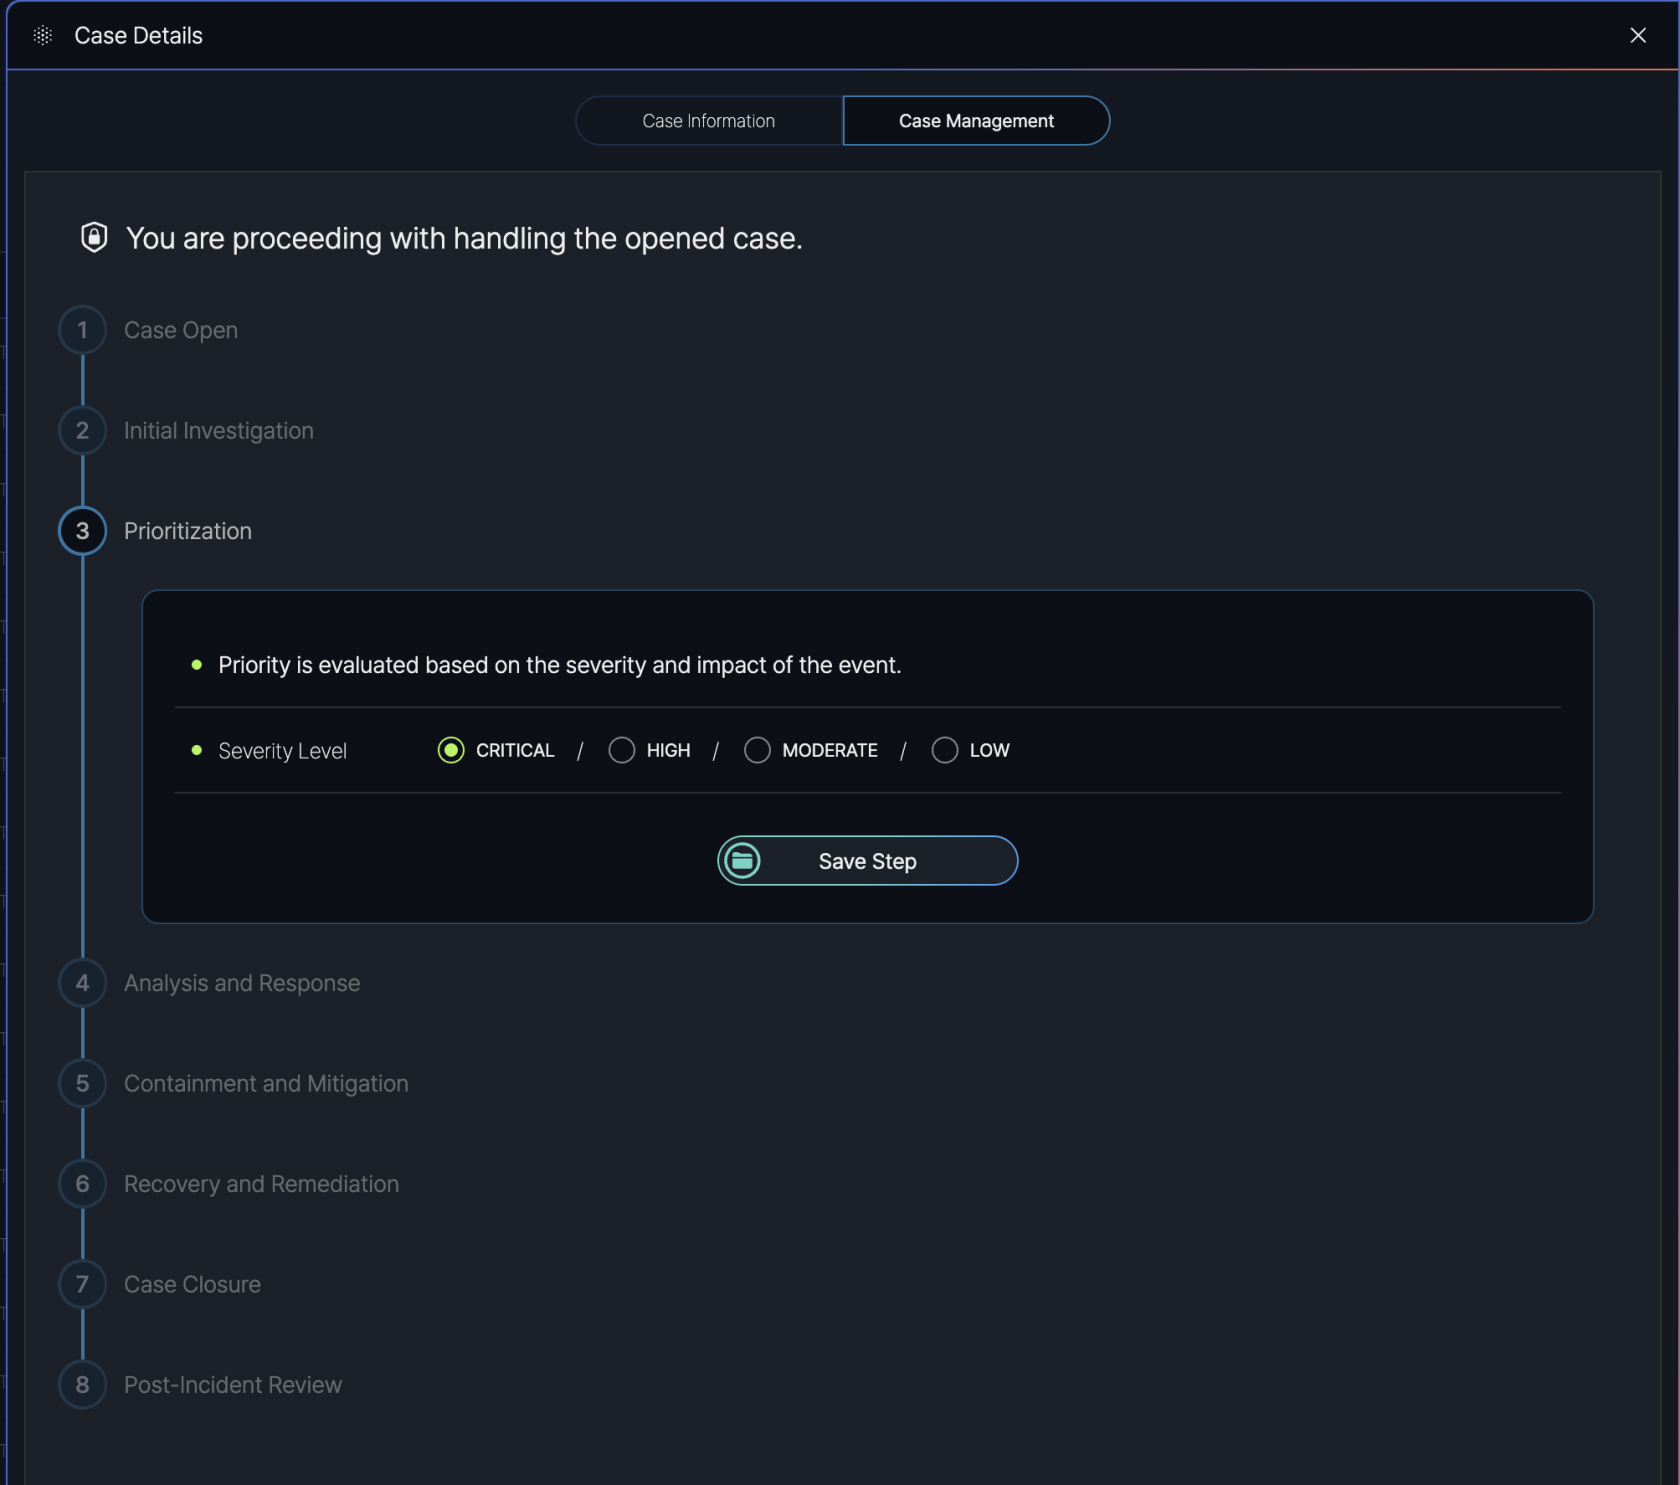
**Purpose**: The "Prioritization" step involves evaluating the case based on its severity and impact to determine the urgency of response. This helps in allocating resources effectively and addressing high-priority incidents first.
**Instructions Provided**: - **Priority Evaluation**: Users are informed that "Priority is evaluated based on the severity and impact of the event."
- **Severity Level Selection**: Users can select the severity level of the case from the following options:
- **Critical**: For incidents with severe impact requiring immediate action.
- **High**: For incidents with significant impact needing prompt attention.
- **Moderate**: For incidents with moderate impact that can be addressed in a standard timeframe.
- **Low**: For incidents with minimal impact that can be handled with lower urgency.
**Action**: - After selecting the appropriate severity level (e.g., Critical, High, Moderate, or Low), users click the "Save Step" button to record the prioritization and proceed to the next step in the Case Management process.
##### **Step 4. Analysis and Response**
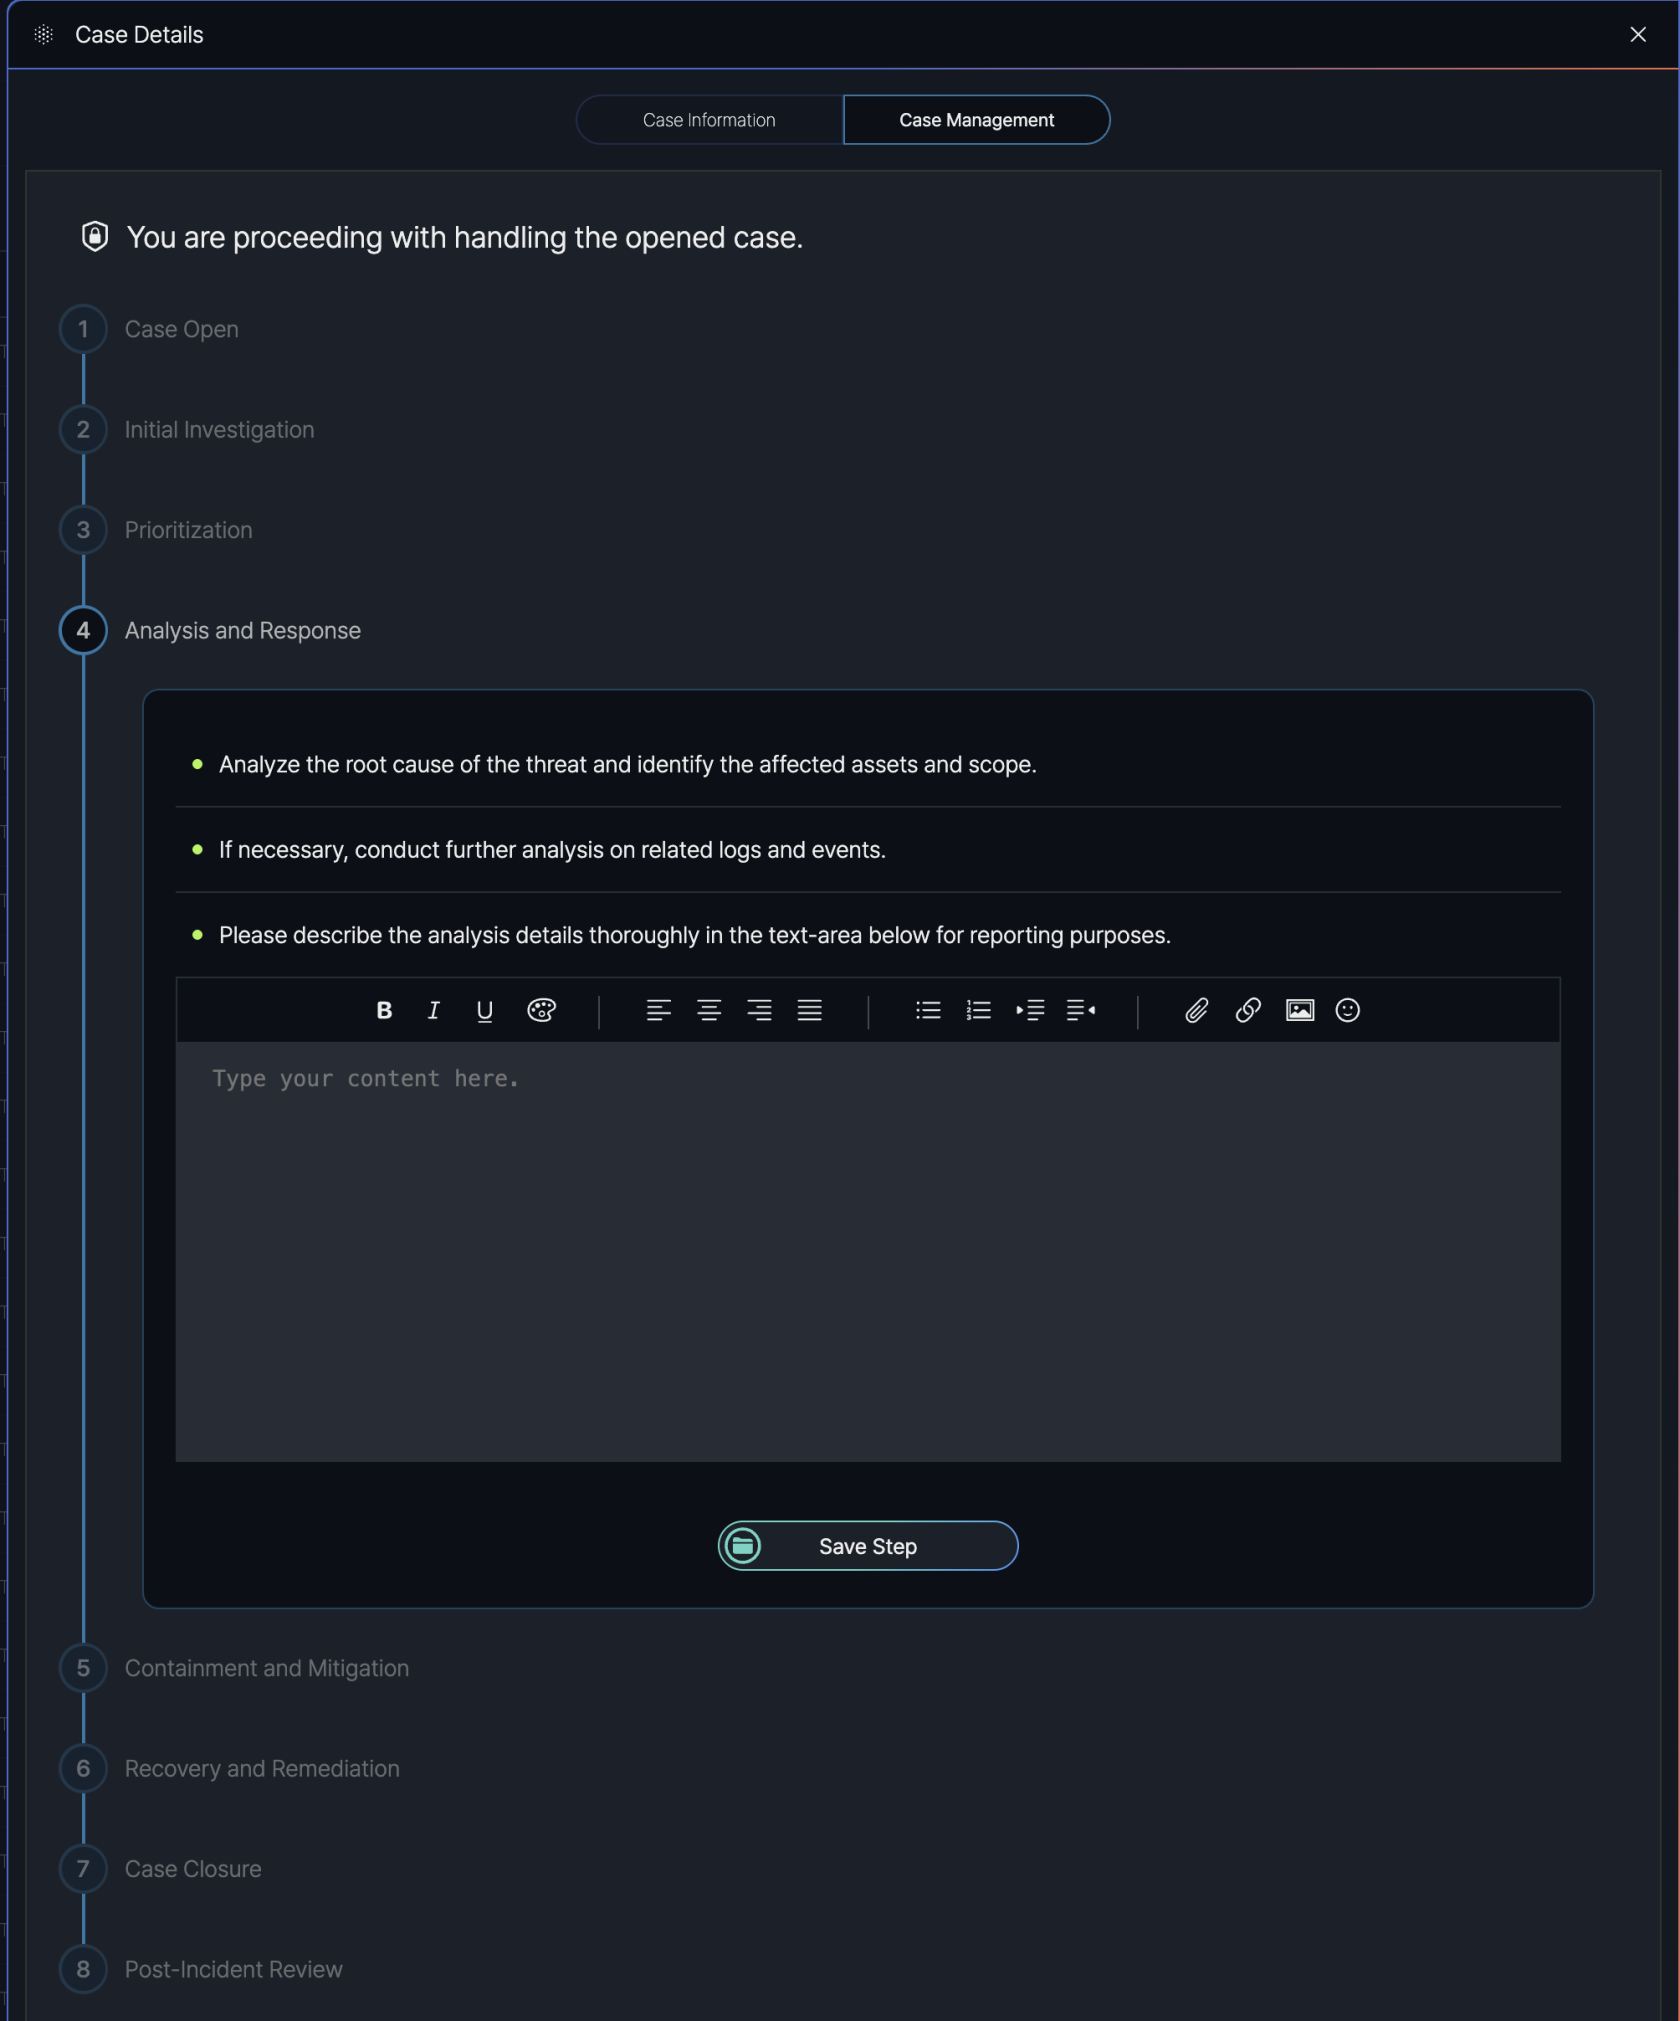
**Purpose**: The "Analysis and Response" step aims to analyze the root cause of the threat, identify the affected assets and scope, and develop a response strategy to mitigate the incident.
**Instructions Provided**: - **Analyze the Threat**: Users are prompted to "Analyze the root cause of the threat and identify the affected assets and scope."
- **Further Analysis**: If needed, users are advised to "conduct further analysis on related logs and events" to gain deeper insights into the incident.
- **Document Findings**: Users are required to "describe the analysis details thoroughly in the text-area below for reporting purposes." A text editor is provided to input detailed notes, with formatting options such as bold, italic, underline, alignment, lists, links, images, and emojis.
**Action**: - Users enter their analysis details in the text area.
- After completing the analysis and documenting the findings, users click the "Save Step" button to record their work and proceed to the next step in the Case Management process.
##### **Step 5. Containment and Mitigation**
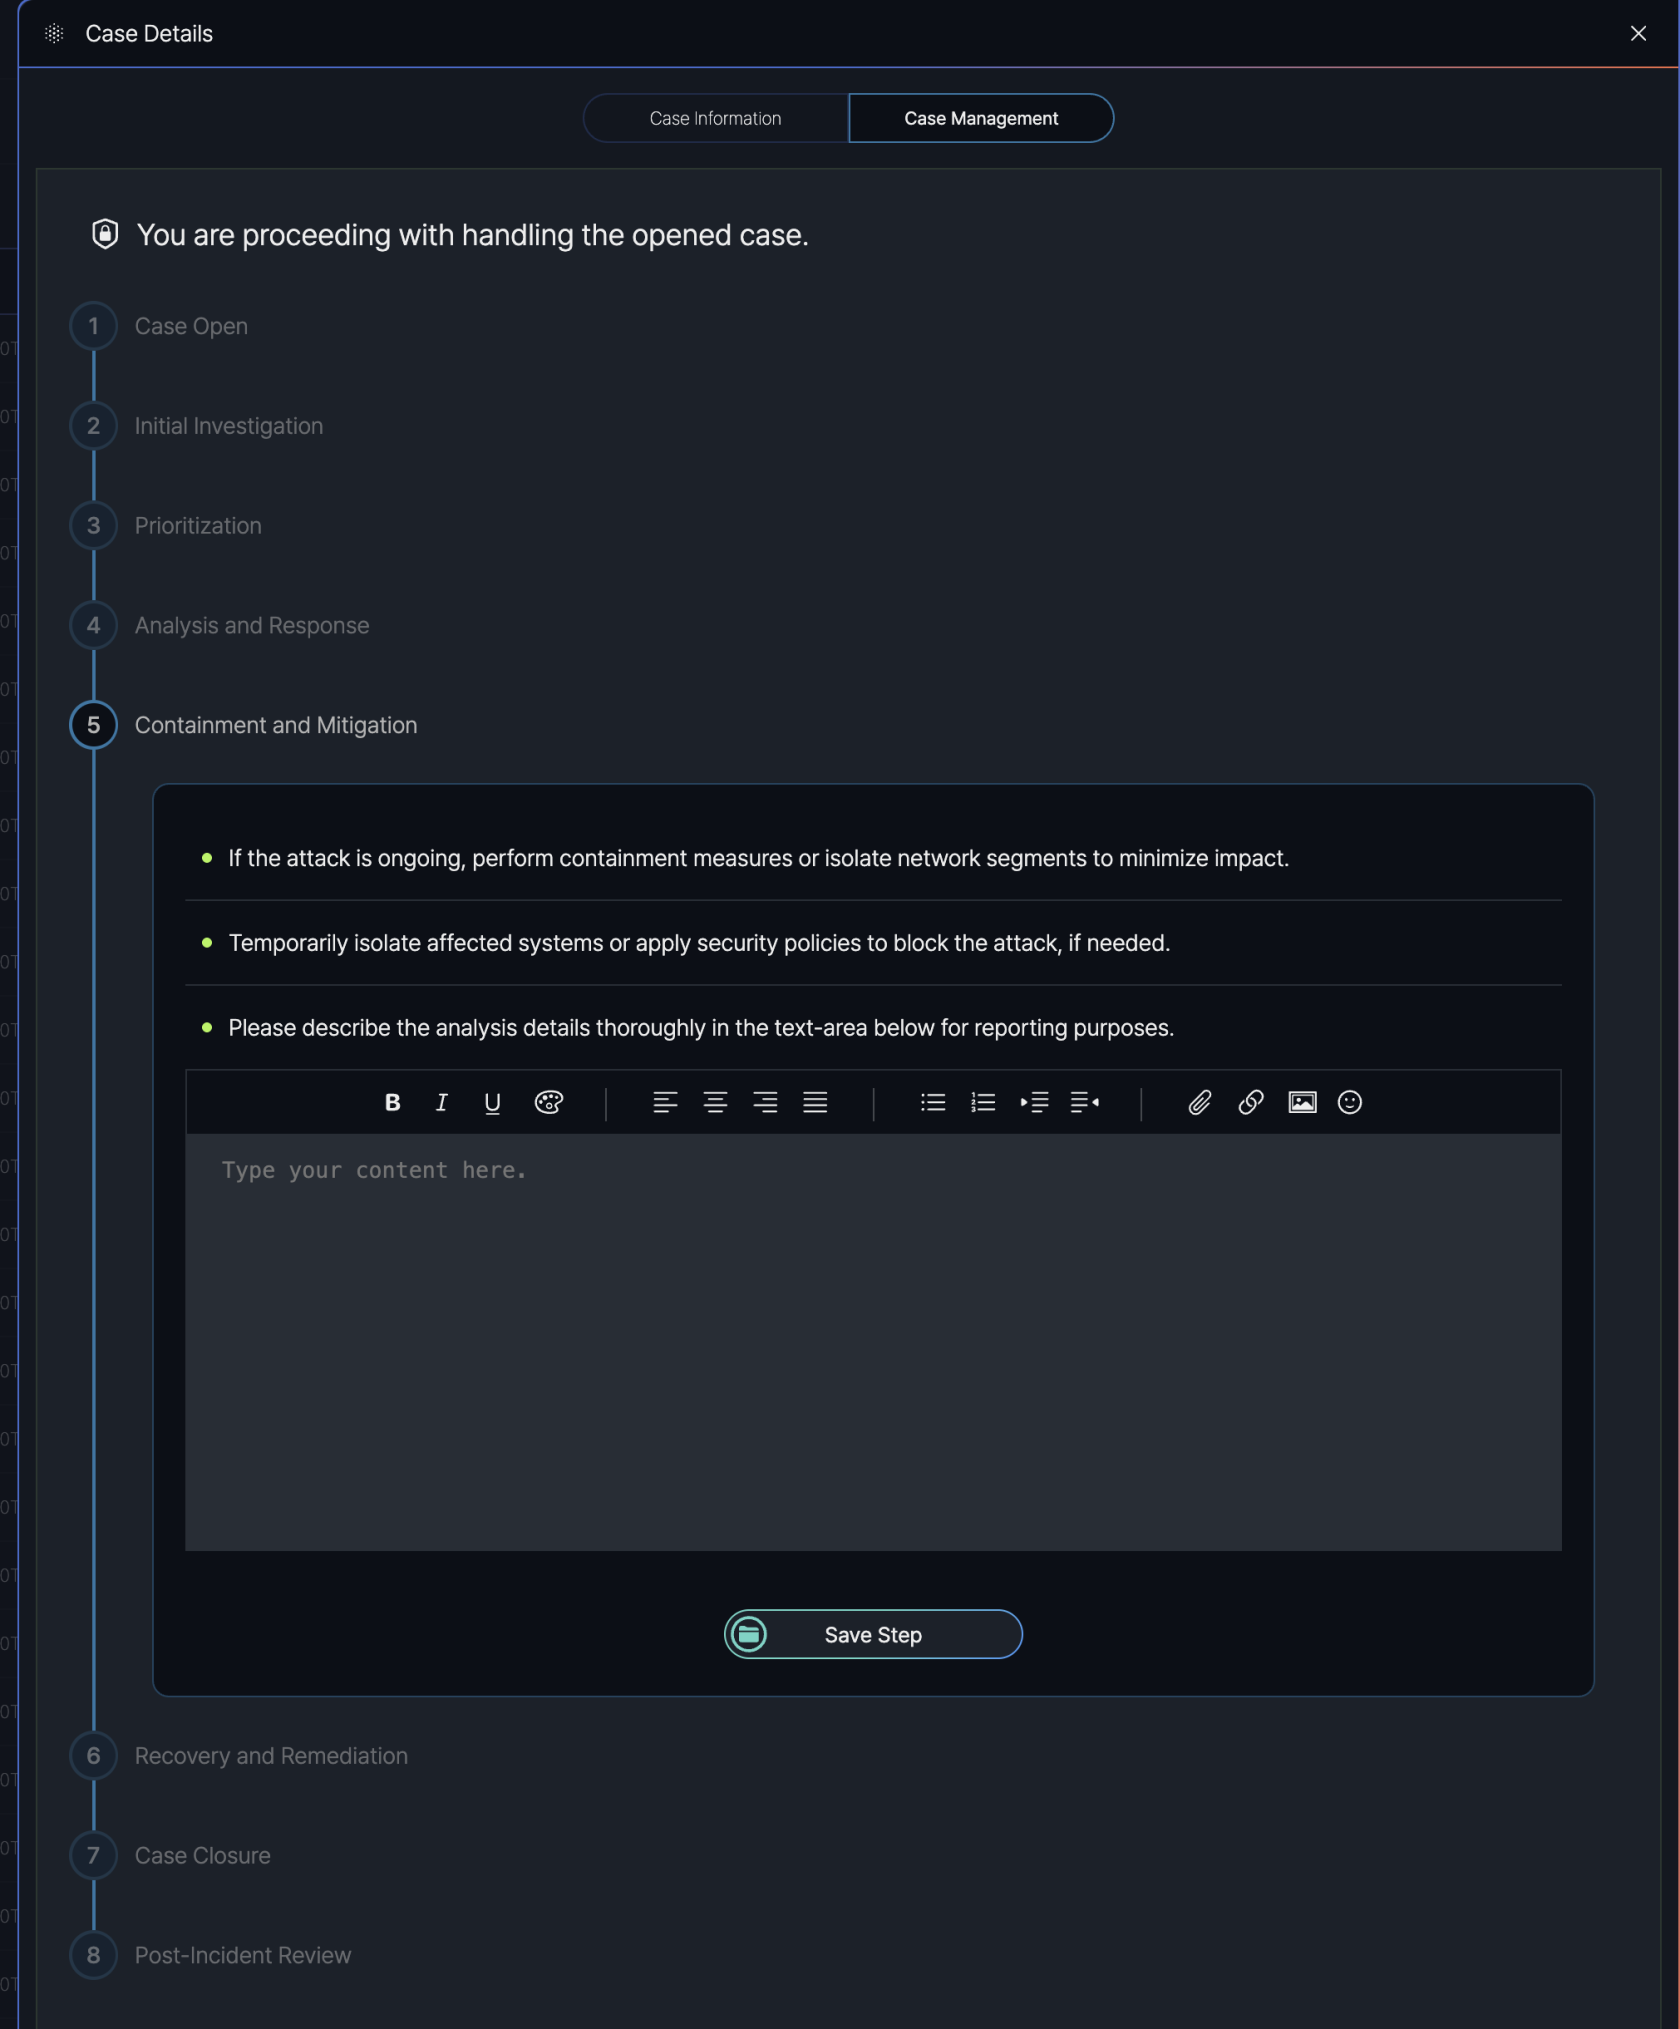
**Purpose**: The "Containment and Mitigation" step aims to limit the spread and impact of the incident by isolating affected systems and applying necessary security measures.
**Instructions Provided**: - **Containment Measures**: Users are advised to "perform containment measures or isolate network segments to minimize impact" if the attack is ongoing.
- **Isolation and Blocking**: Users are instructed to "temporarily isolate affected systems or apply security policies to block the attack, if needed."
- **Document Actions**: Users are required to "describe the analysis details thoroughly in the text-area below for reporting purposes." A text editor is provided to input detailed notes, with formatting options such as bold, italic, underline, alignment, lists, links, images, and emojis.
**Action**:
- Users document the containment and mitigation actions taken in the text area.
- After completing the actions and documenting the details, users click the "Save Step" button to record their work and proceed to the next step in the Case Management process.
##### **Step 6. Recovery and Remediation**
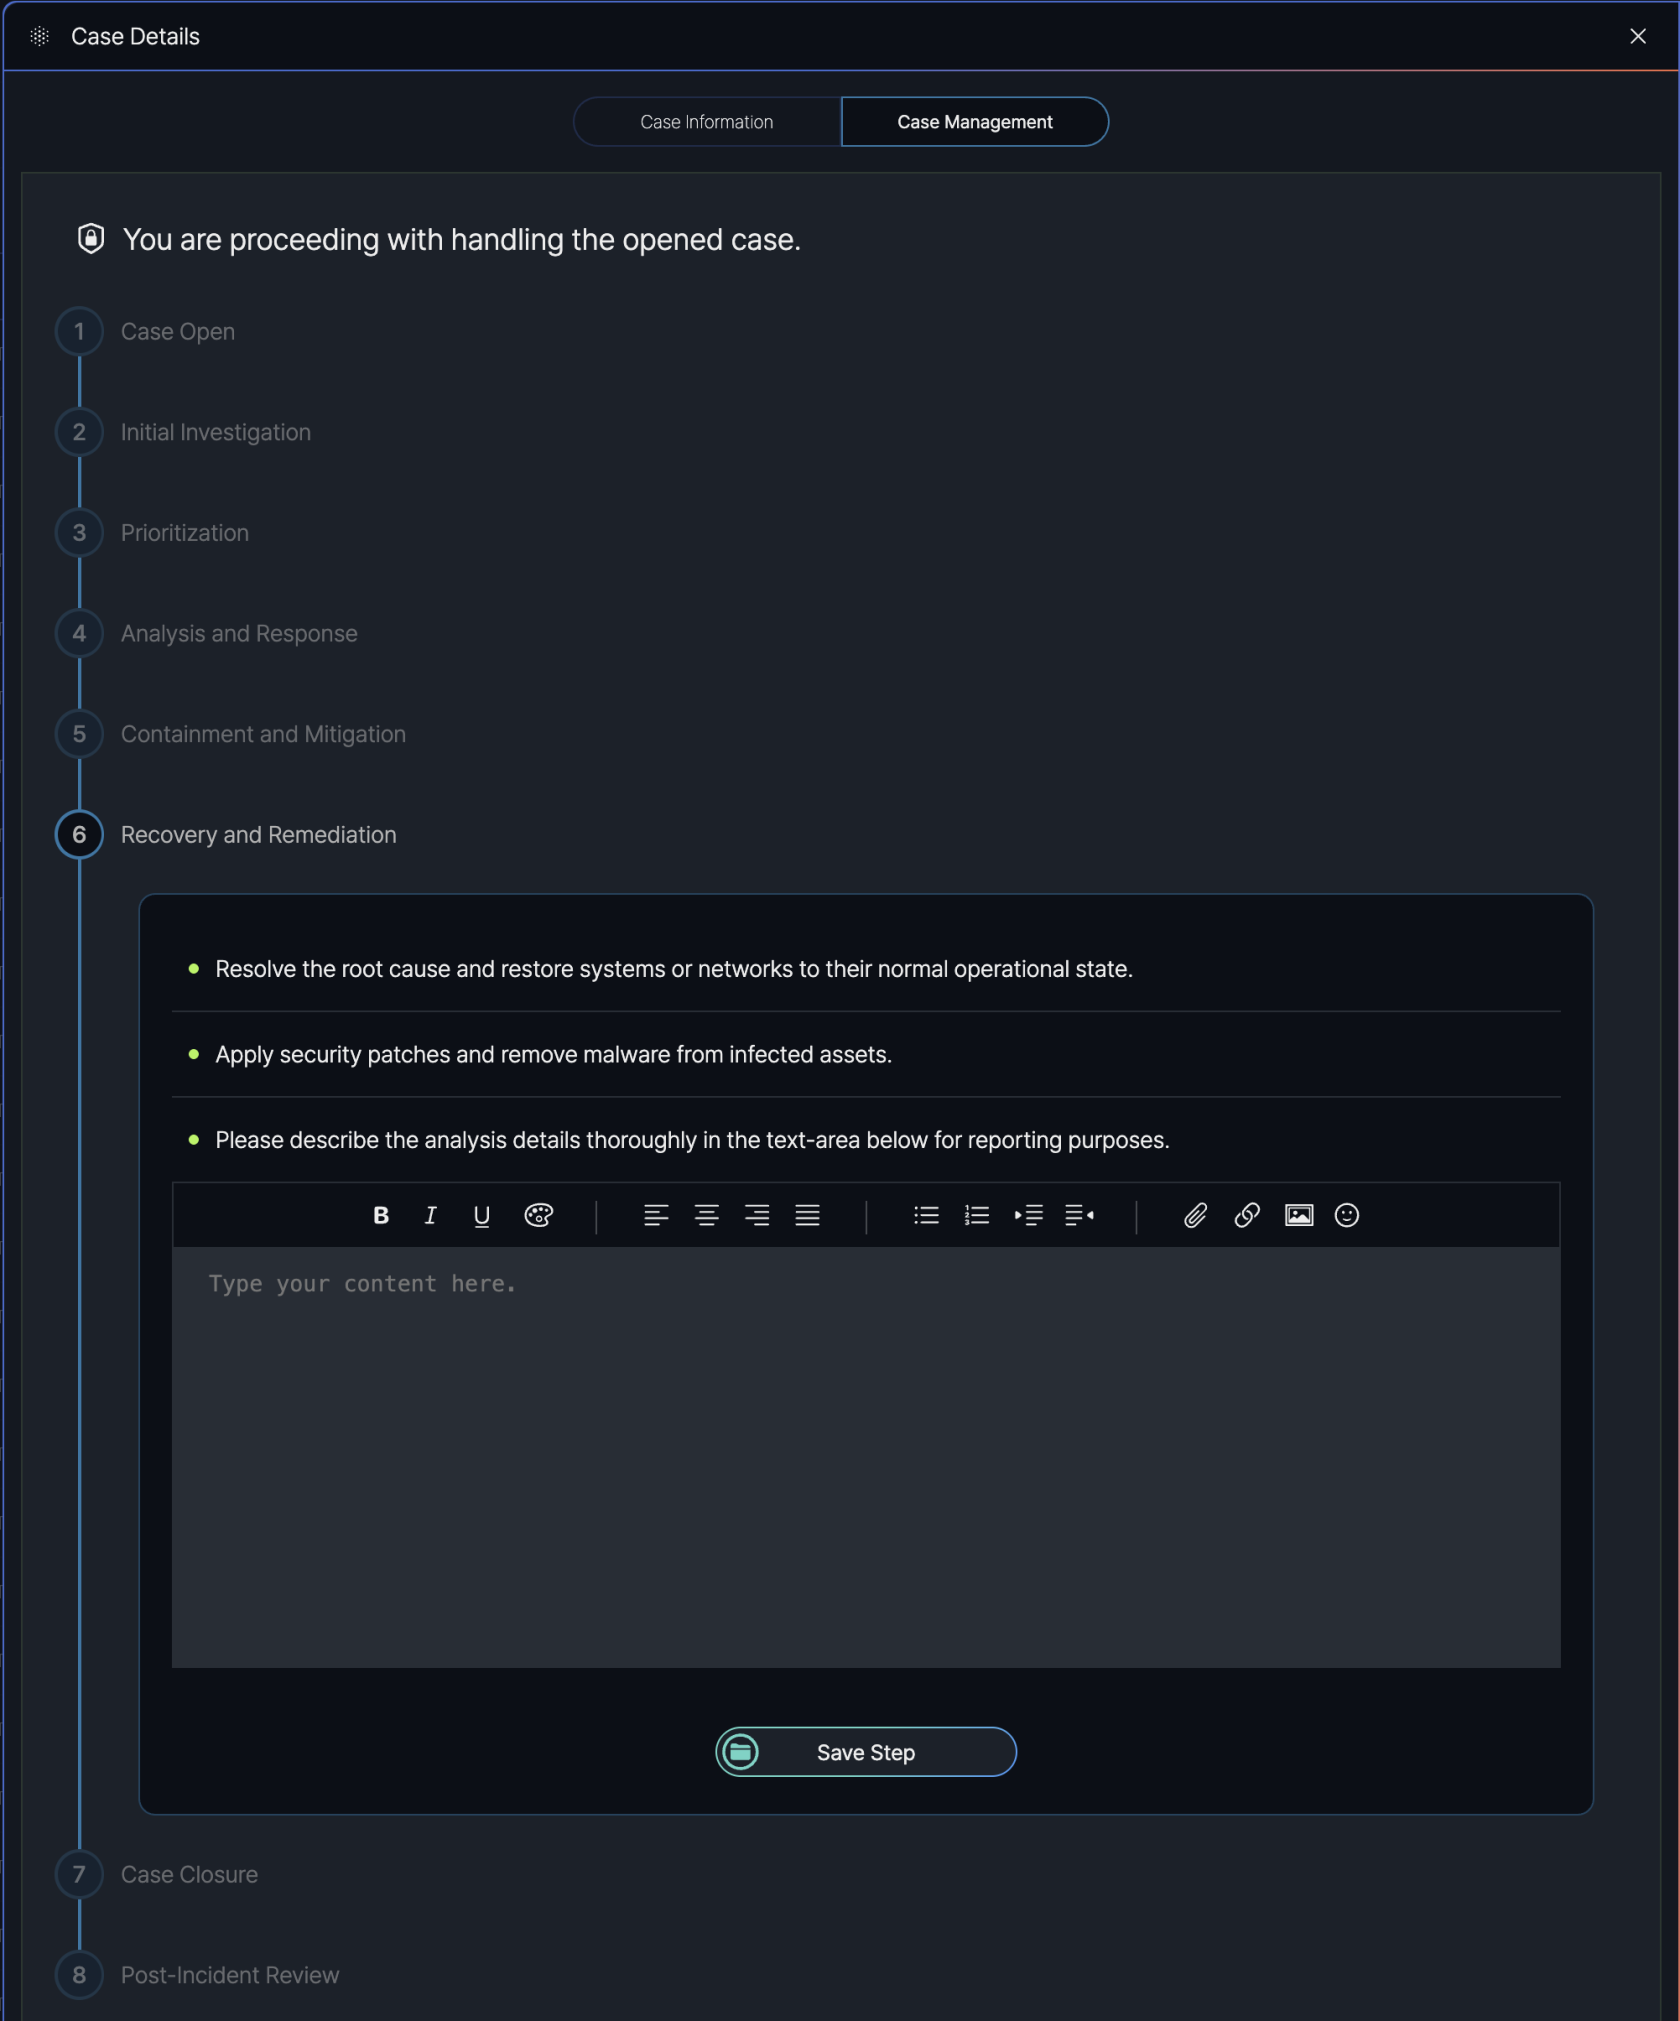
**Purpose**: The "Recovery and Remediation" step aims to fully resolve the incident by addressing its root cause, restoring systems or networks to their normal operational state, and applying preventive measures to avoid recurrence.
**Instructions Provided**: - **Resolve and Restore**: Users are instructed to "resolve the root cause and restore systems or networks to their normal operational state."
- **Apply Security Measures**: Users are advised to "apply security patches and remove malware from infected assets" to secure the environment.
- **Document Actions**: Users are required to "describe the analysis details thoroughly in the text-area below for reporting purposes." A text editor is provided to input detailed notes, with formatting options such as bold, italic, underline, alignment, lists, links, images, and emojis.
**Action**: - Users document the recovery and remediation actions taken in the text area.
- After completing the actions and documenting the details, users click the "Save Step" button to record their work and proceed to the next step in the Case Management process.
##### **Step 7. Case Closure**
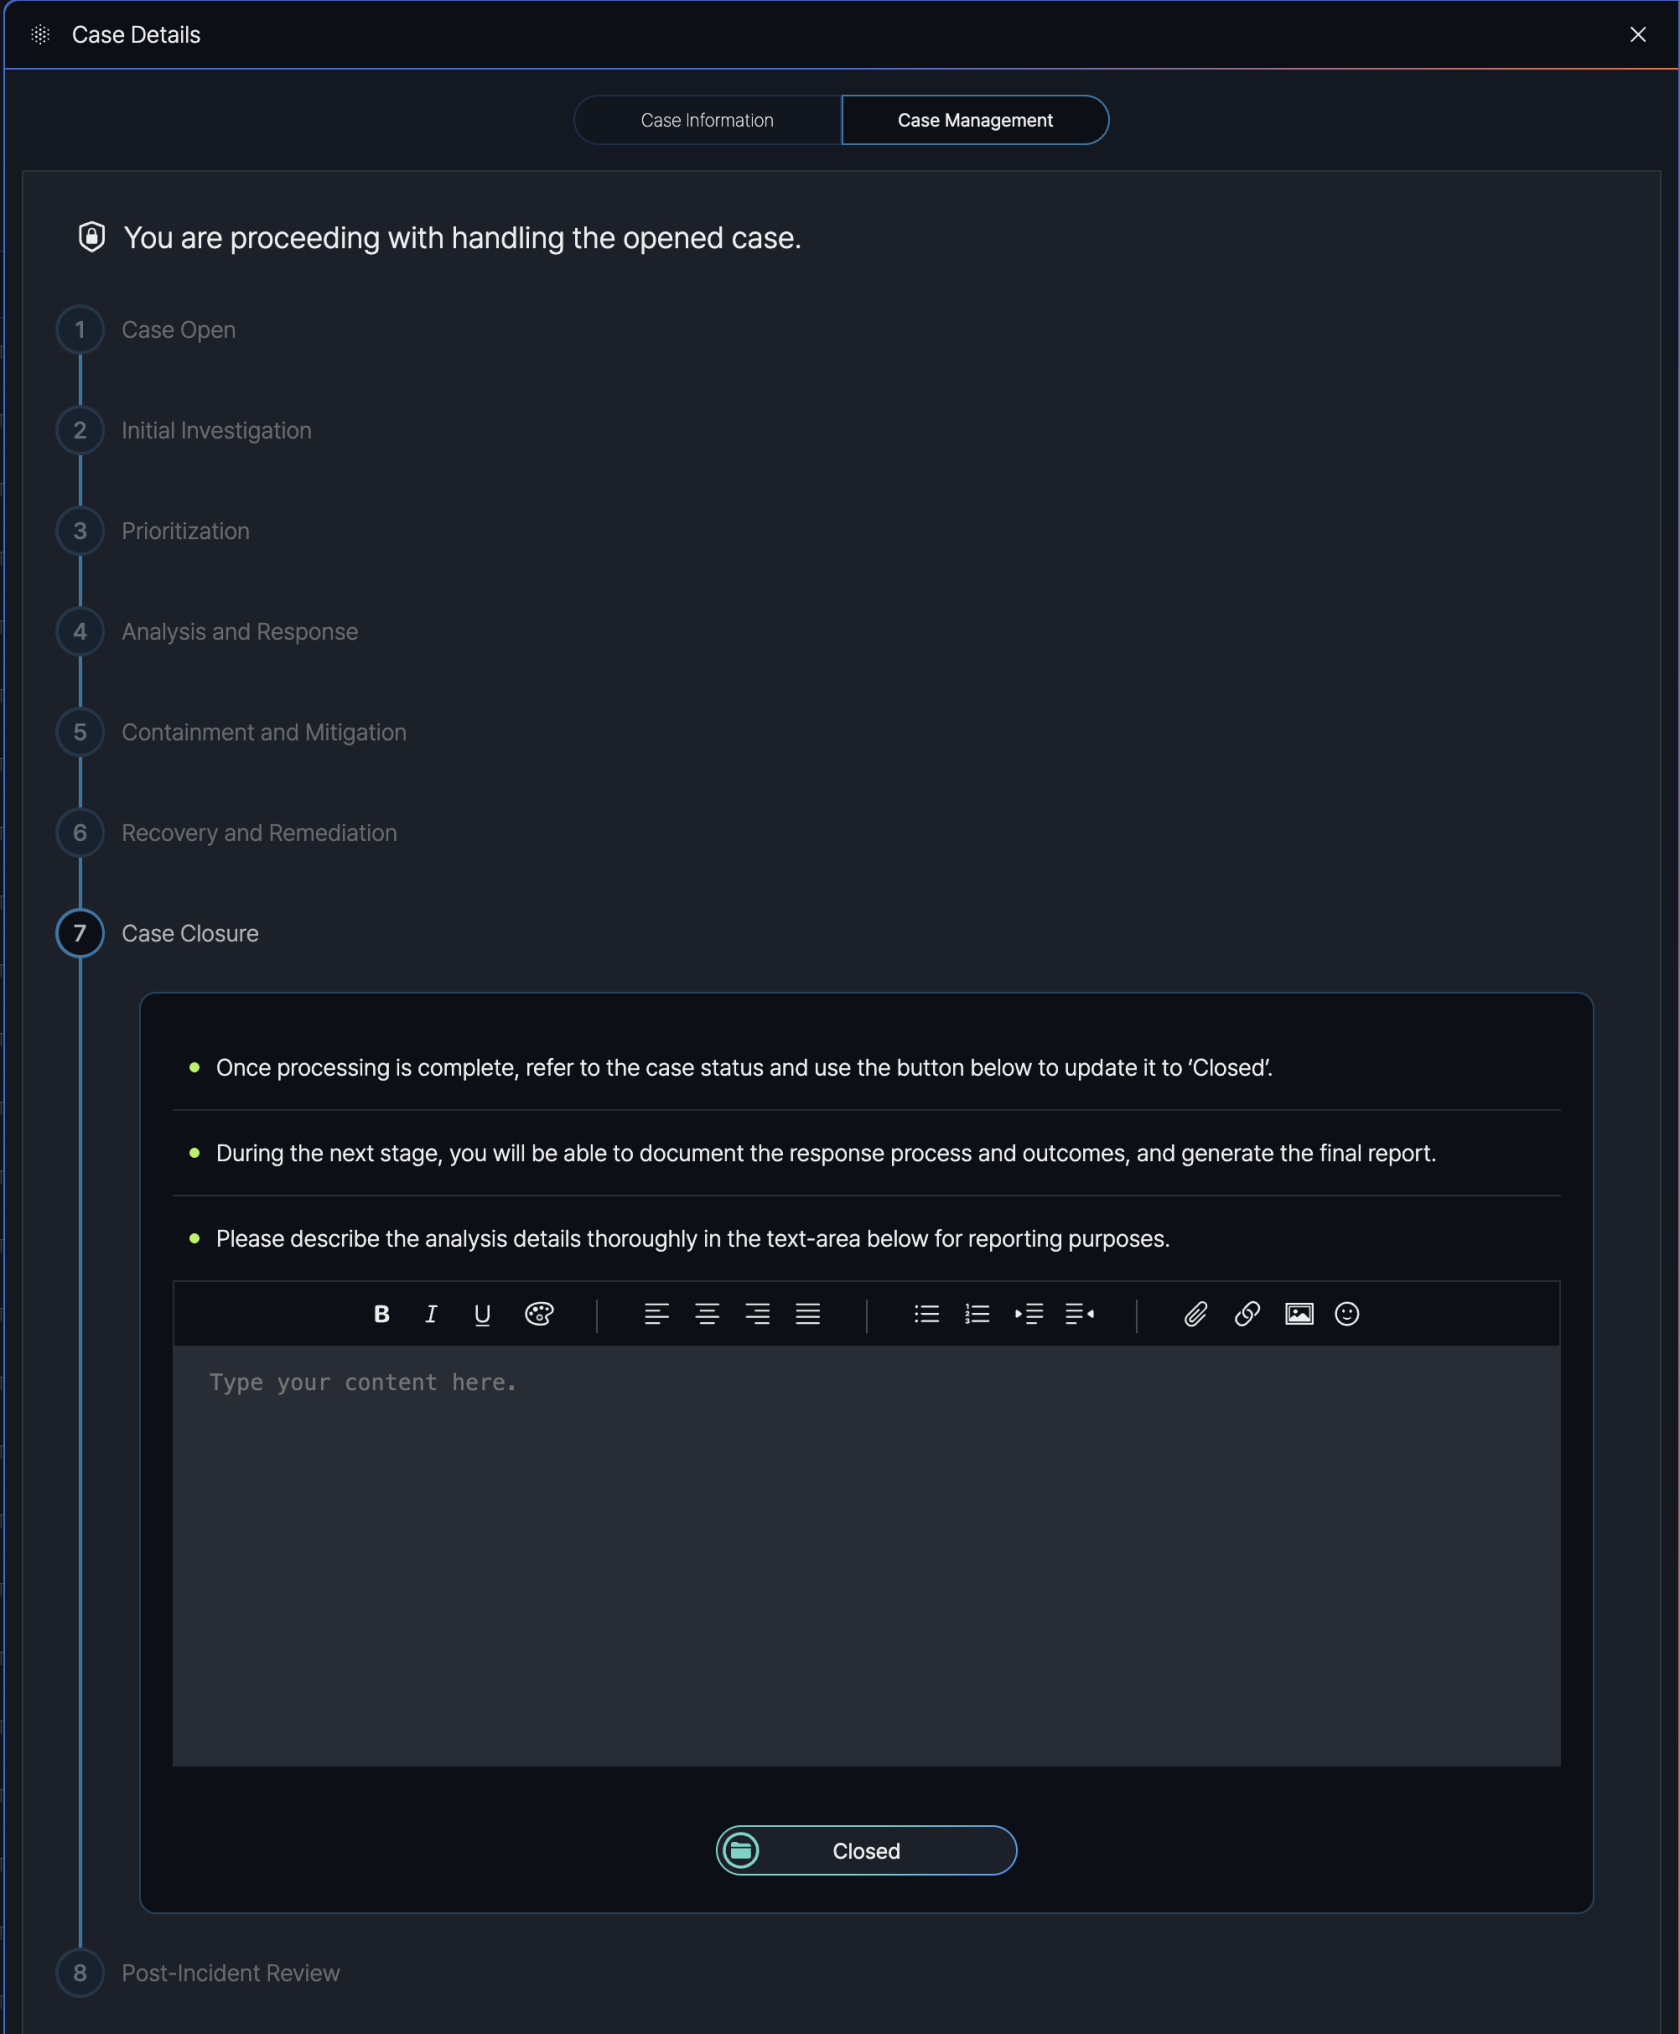
**Purpose**: The "Case Closure" step marks the completion of the case handling process, confirming that the incident has been resolved and all necessary actions have been taken.
**Instructions Provided**: - **Update Case Status**: Users are instructed to "refer to the case status and use the button below to update it to ‘Closed’" once processing is complete.
- **Prepare for Next Stage**: Users are informed that "during the next stage, you will be able to document the response process and outcomes, and generate the final report."
- **Document Details**: Users are required to "describe the analysis details thoroughly in the text-area below for reporting purposes." A text editor is provided to input detailed notes, with formatting options such as bold, italic, underline, alignment, lists, links, images, and emojis.
**Action**: - Users document the final details of the case resolution in the text area.
- After documenting the details, users click the "Closed" button to officially close the case and proceed to the final step in the Case Management process.
##### **Step 8. Post-Incident Review**
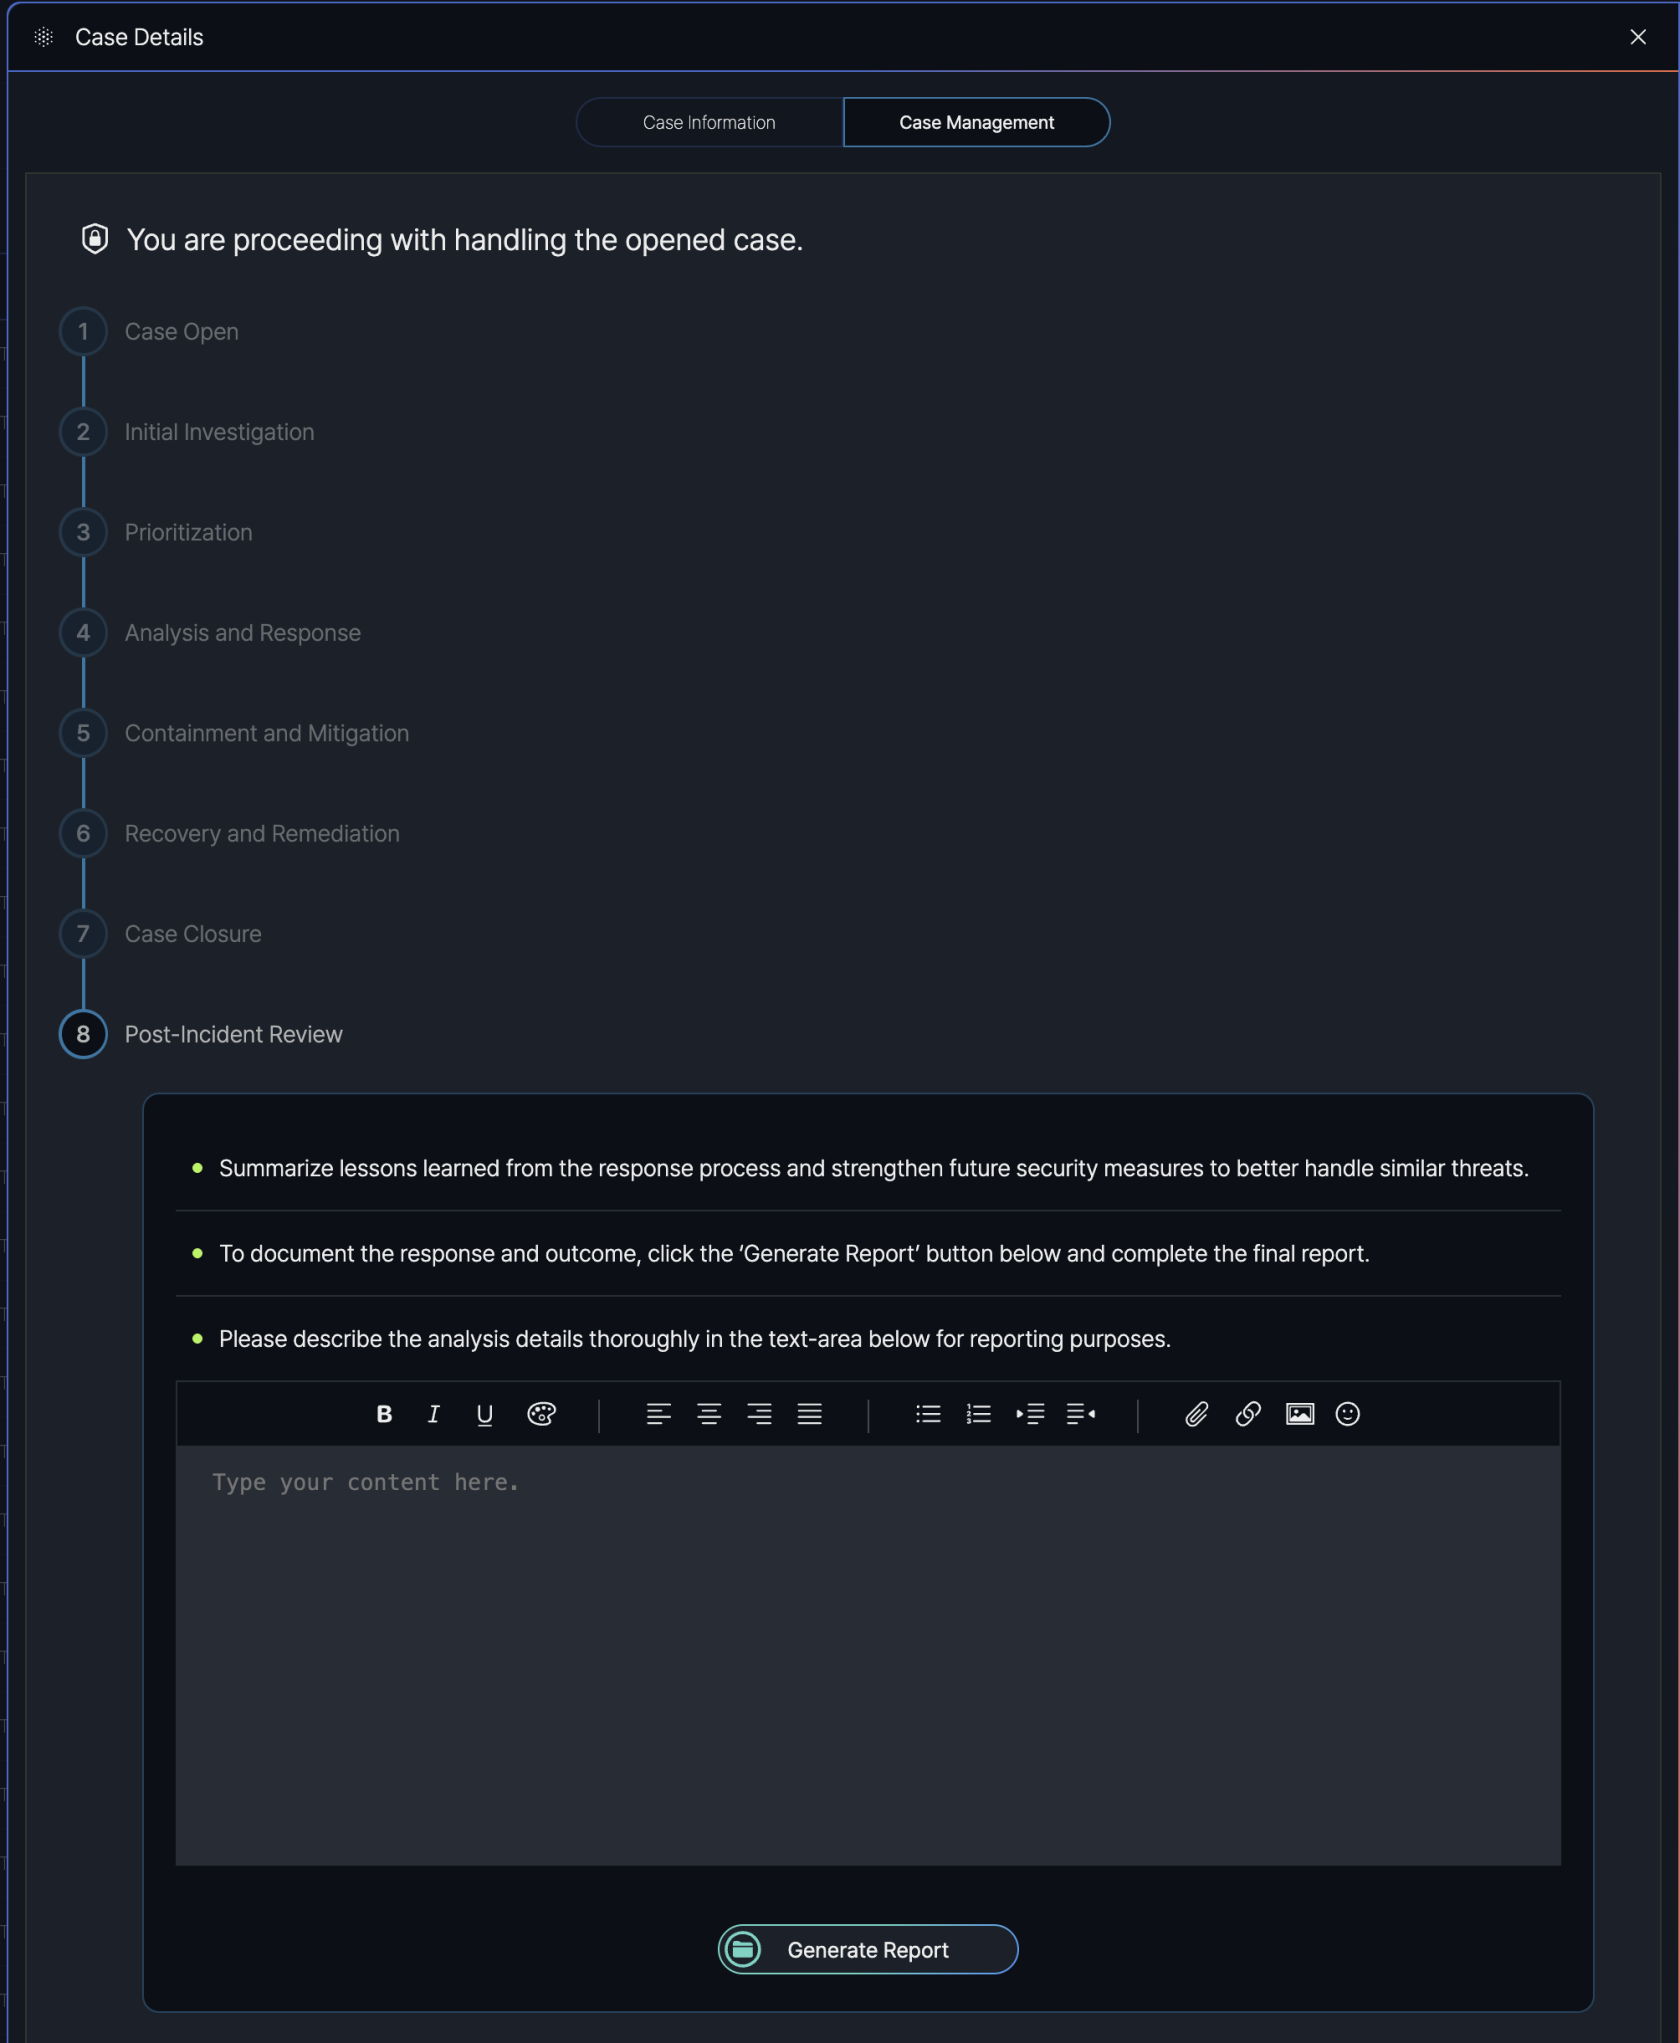
**Purpose**: The "Post-Incident Review" step aims to summarize the lessons learned from the incident response process and strengthen future security measures to better handle similar threats.
**Instructions Provided**: - **Summarize Lessons Learned**: Users are instructed to "summarize lessons learned from the response process and strengthen future security measures to better handle similar threats."
- **Generate Final Report**: Users are advised to "document the response and outcomes, click the ‘Generate Report’ button below and complete the final report."
- **Document Details**: Users are required to "describe the analysis details thoroughly in the text-area below for reporting purposes." A text editor is provided to input detailed notes, with formatting options such as bold, italic, underline, alignment, lists, links, images, and emojis.
**Action**: - Users document the lessons learned and post-incident analysis in the text area.
- After documenting the details, users click the "**Generate Report**" button to compile the final report, concluding the Case Management process.
##### **Report Generation**
[](https://book.weetizen.com/uploads/images/gallery/2025-04/Ireimage.png)
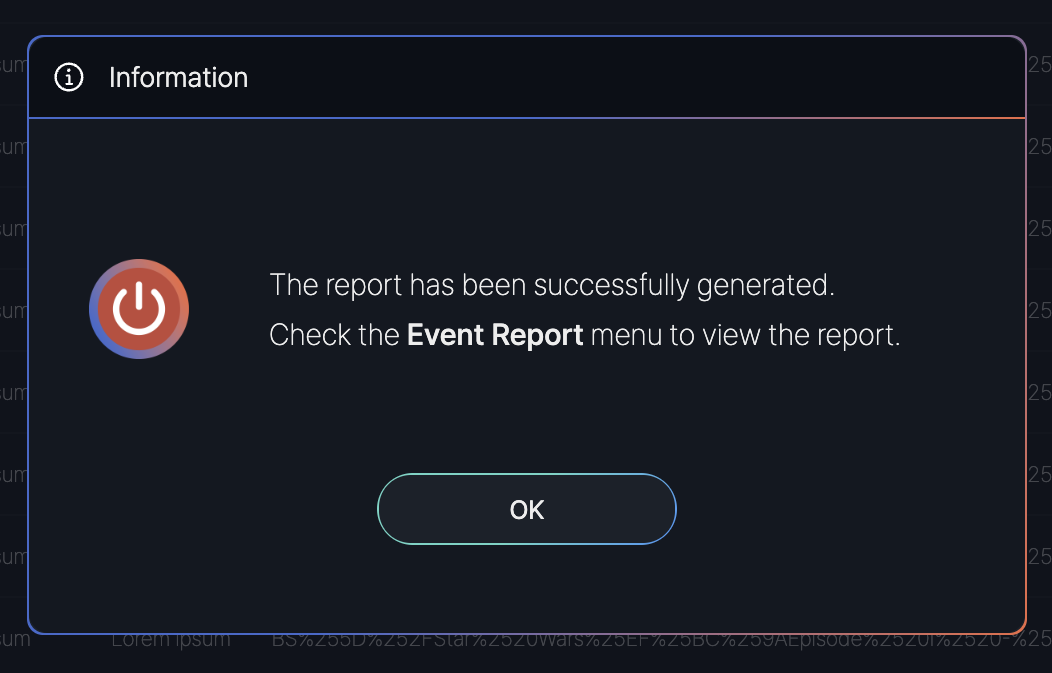
After completing all eight steps in the Case Management process, including the **Post-Incident Review**, a confirmation message is displayed in the SmartWAN Portal.
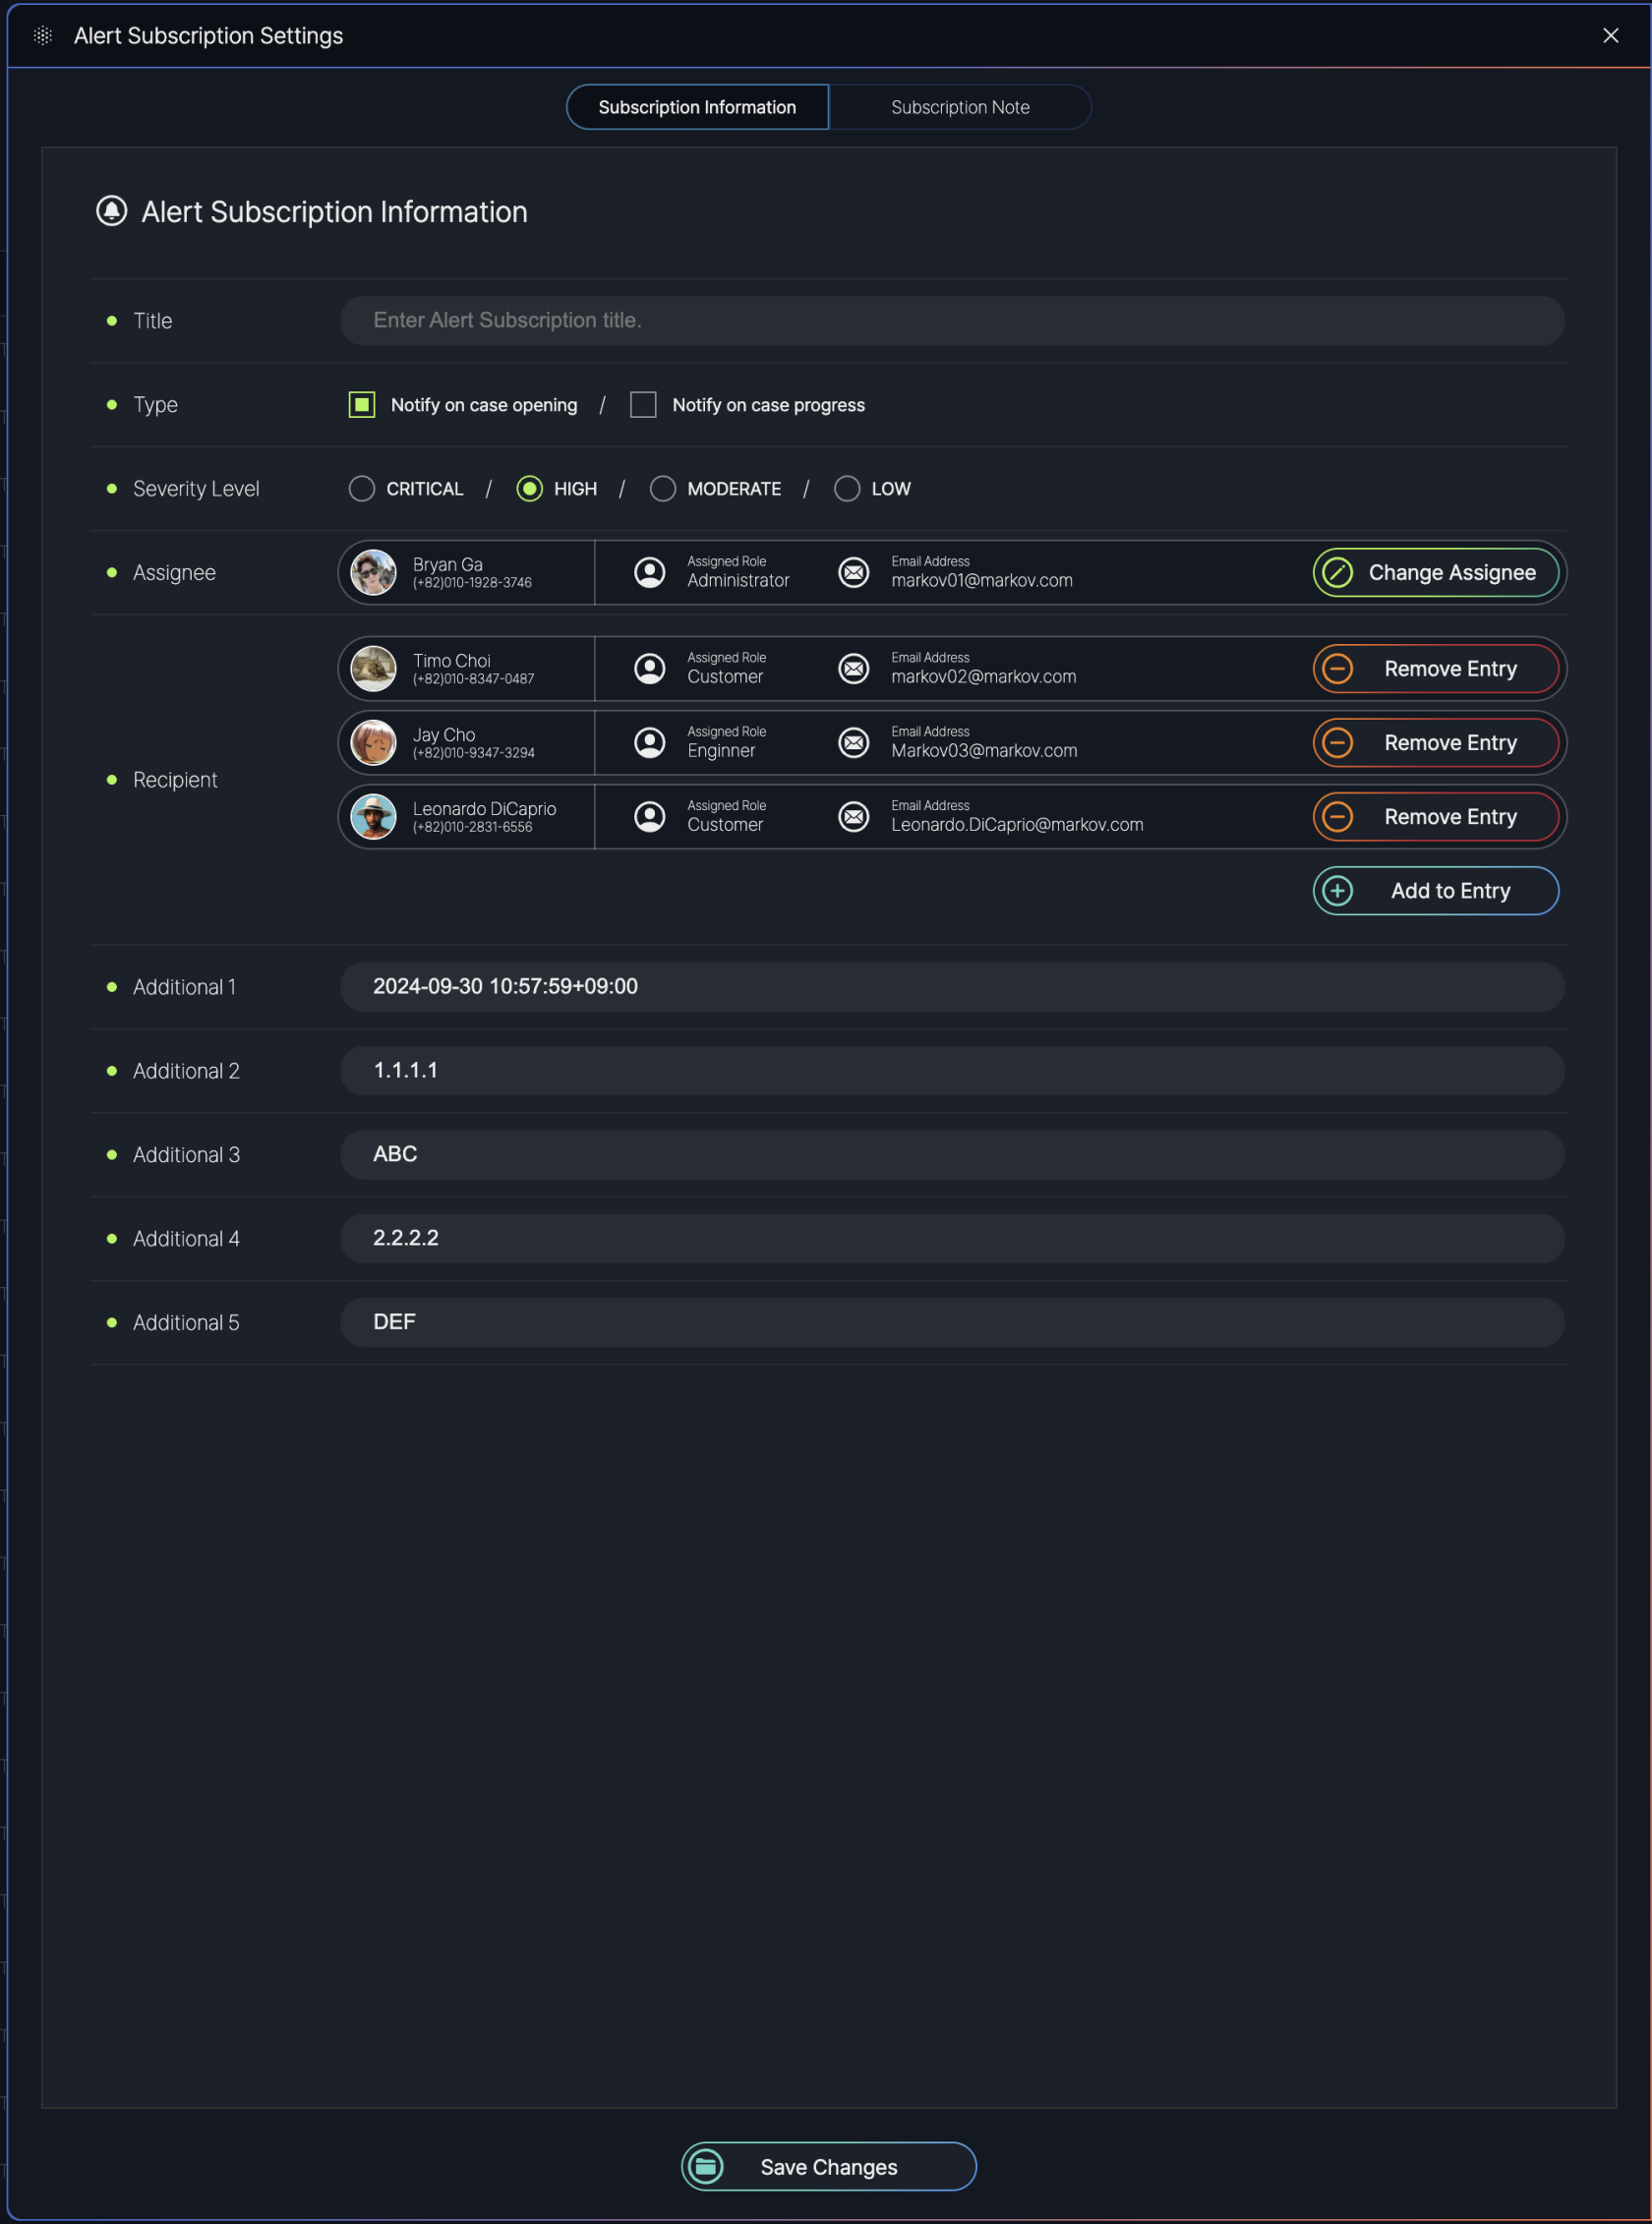
The **Alert Subscription Settings** screen in the SmartWAN Portal allows users to customize how they receive notifications for cases. This screen is accessed by clicking the "Notification Settings" button on the **Case List** screen.
Users can configure various aspects of alert subscriptions, including the type of notifications, severity levels, assignees, recipients, and additional metadata, ensuring they are informed about relevant cases in a timely manner.
##### **Subscription Information**
[](https://book.weetizen.com/uploads/images/gallery/2025-04/Y1cimage.png)
**Subscription Information**: - **Title**: A text field to enter a custom title for the alert subscription.
- **Type**: Checkboxes to select the type of notifications:
- **Notify on case opening**: Sends an alert when a new case is created.
- **Notify on case progress**: Sends an alert when a case’s status is updated.
- **Severity Level**: Radio buttons to select the severity level of cases to be notified about.
**Assignee and Recipient Management**: - **Assignee**: Displays a list of users assigned to receive alerts, including:
- **Name**: The assignee’s name (e.g., Bryan Ga, Timo Choi, Jay Cho, Leonardo DiCaprio).
- **Assigned Role**: The role of the assignee (e.g., Administrator, Customer, Engineer).
- **Email Address**: The assignee’s email (e.g., markov01@markov.com).
- **Actions**: Options to "Change Assignee" (reassign to another user) or "Remove Entry" (delete the assignee from the list).
- **Recipient**: Displays a list of additional recipients for alerts, with similar details and actions as the Assignee section.
- **Add to Entry**: A button to add new assignees or recipients to the subscription list.
**Additional Fields**
- Additional fields can be defined by users.
##### **Subscription Note**
[](https://book.weetizen.com/uploads/images/gallery/2025-04/MMTimage.png)
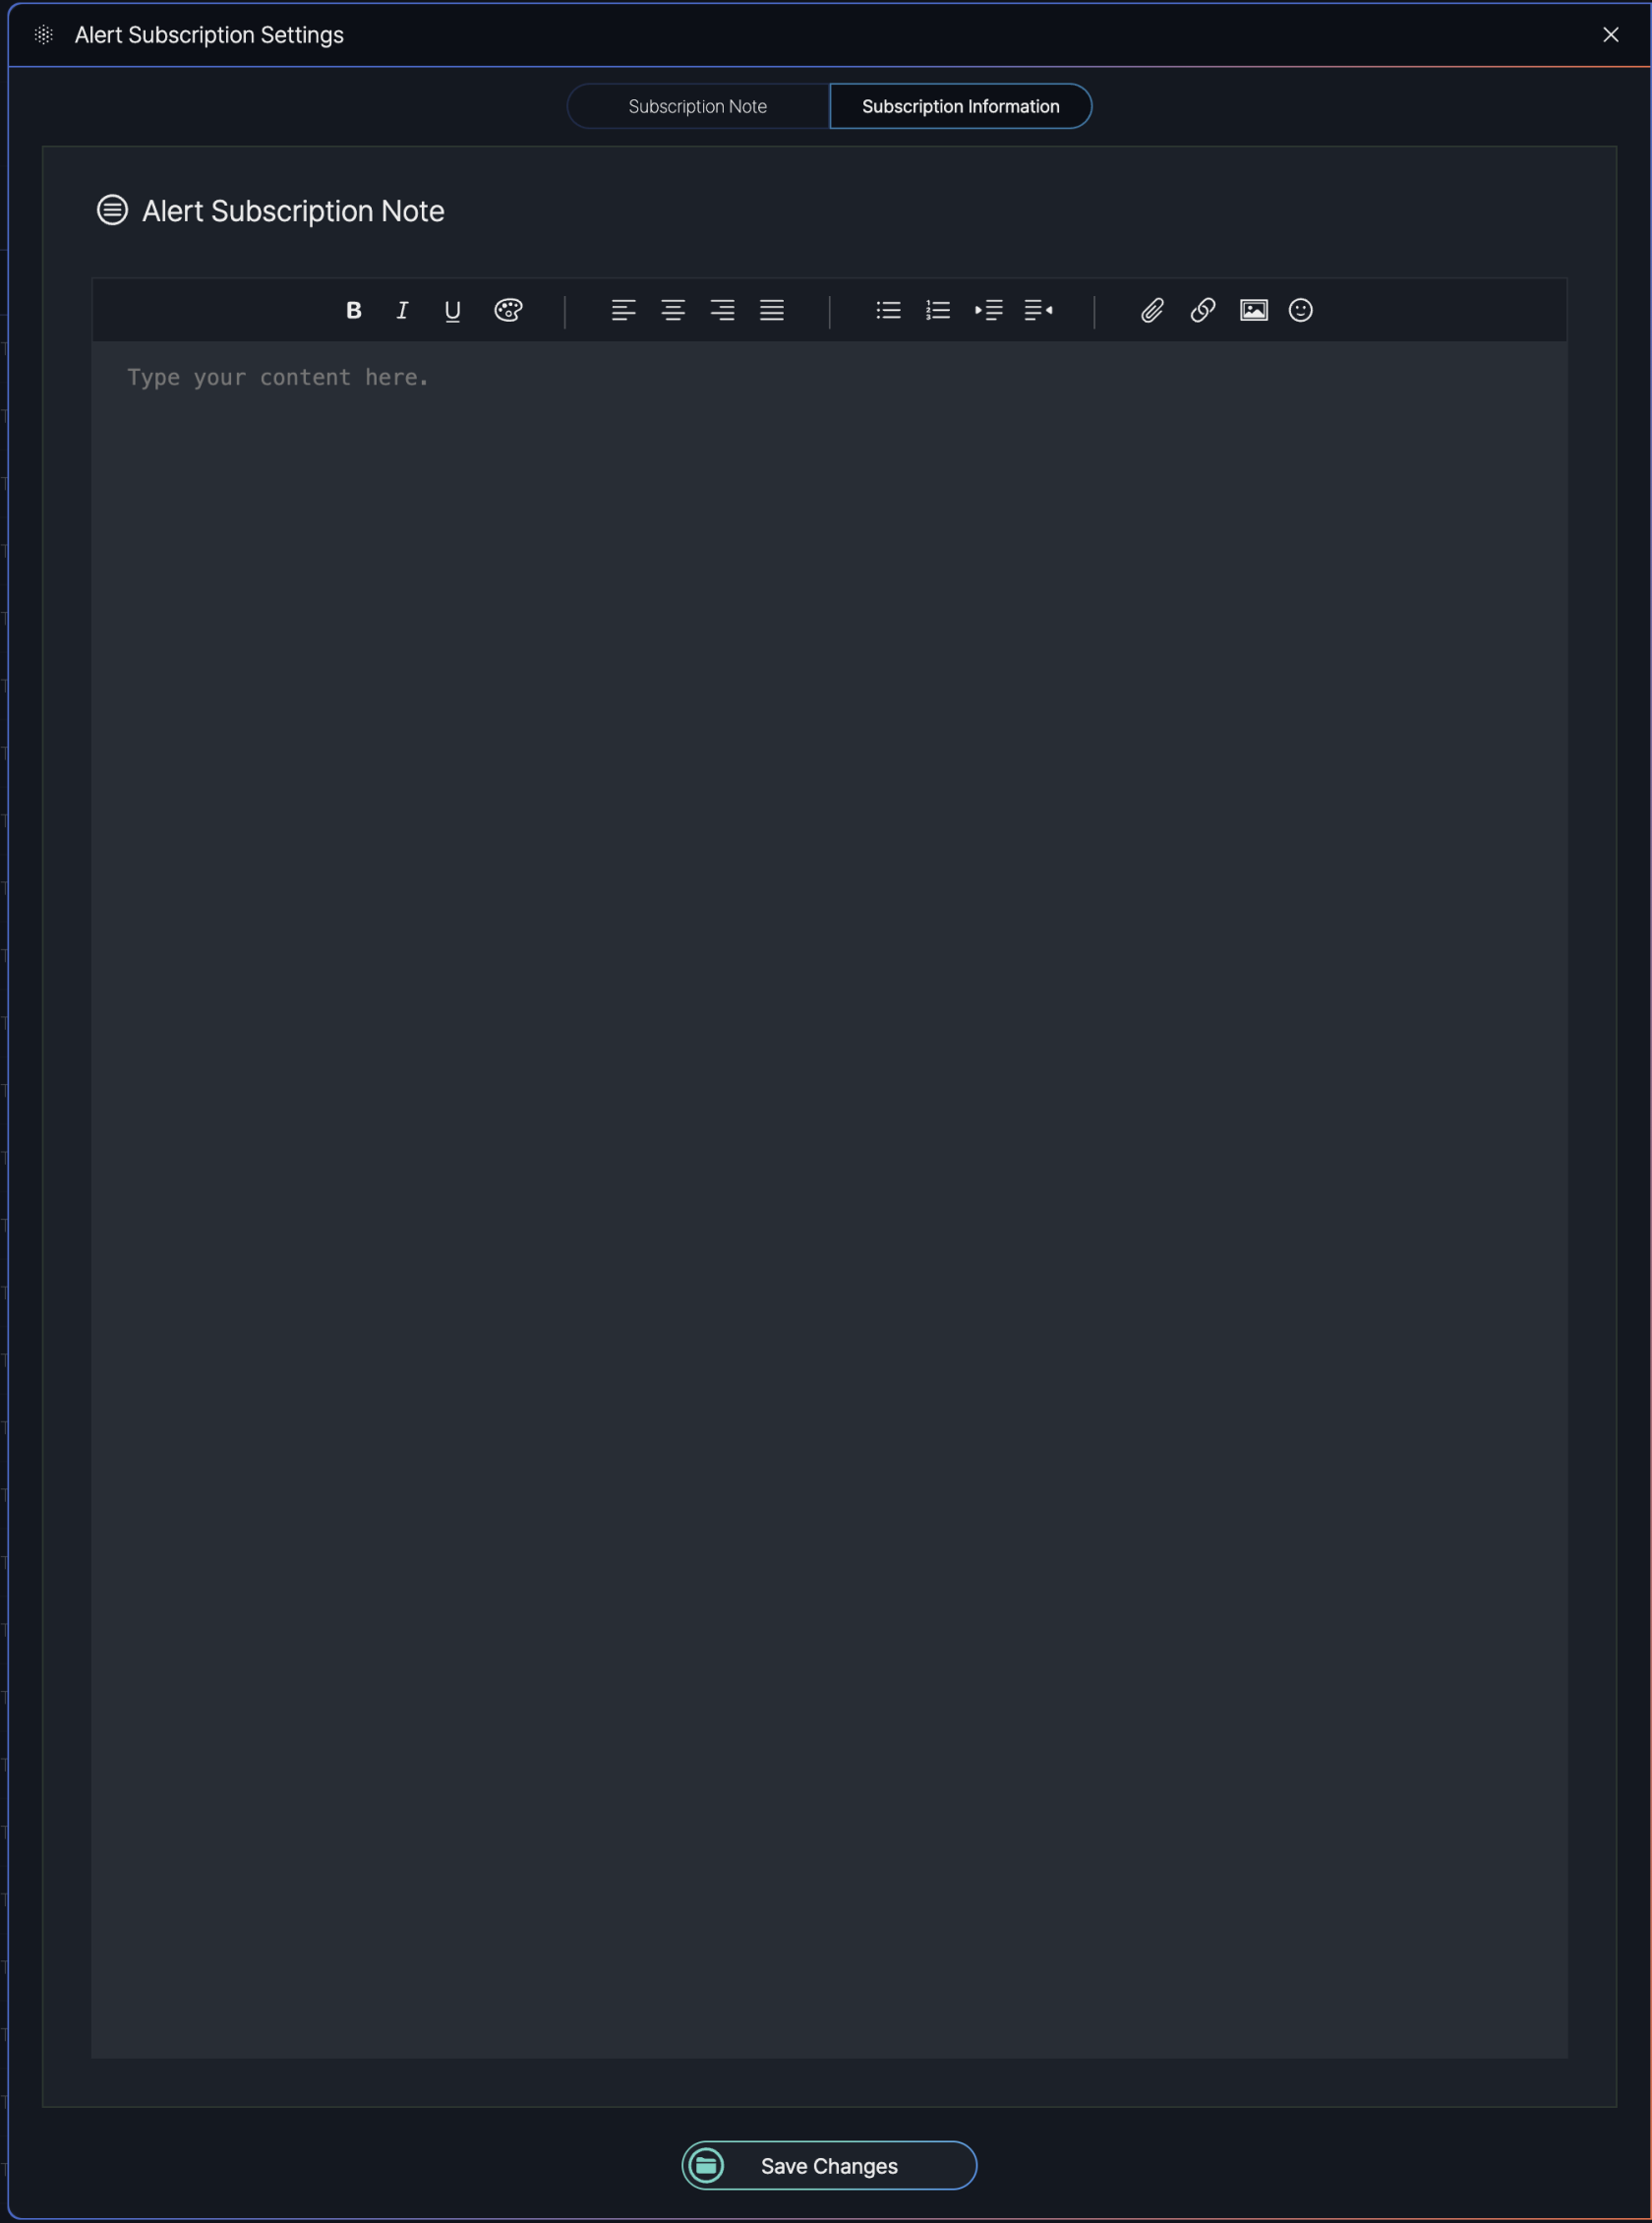
*The **Subscription Note** screen, accessible via a tab in the **Alert Subscription Settings** popup, allows users to add and save notes related to an alert subscription. Users can enter text in a provided text box and save the note for future reference.*
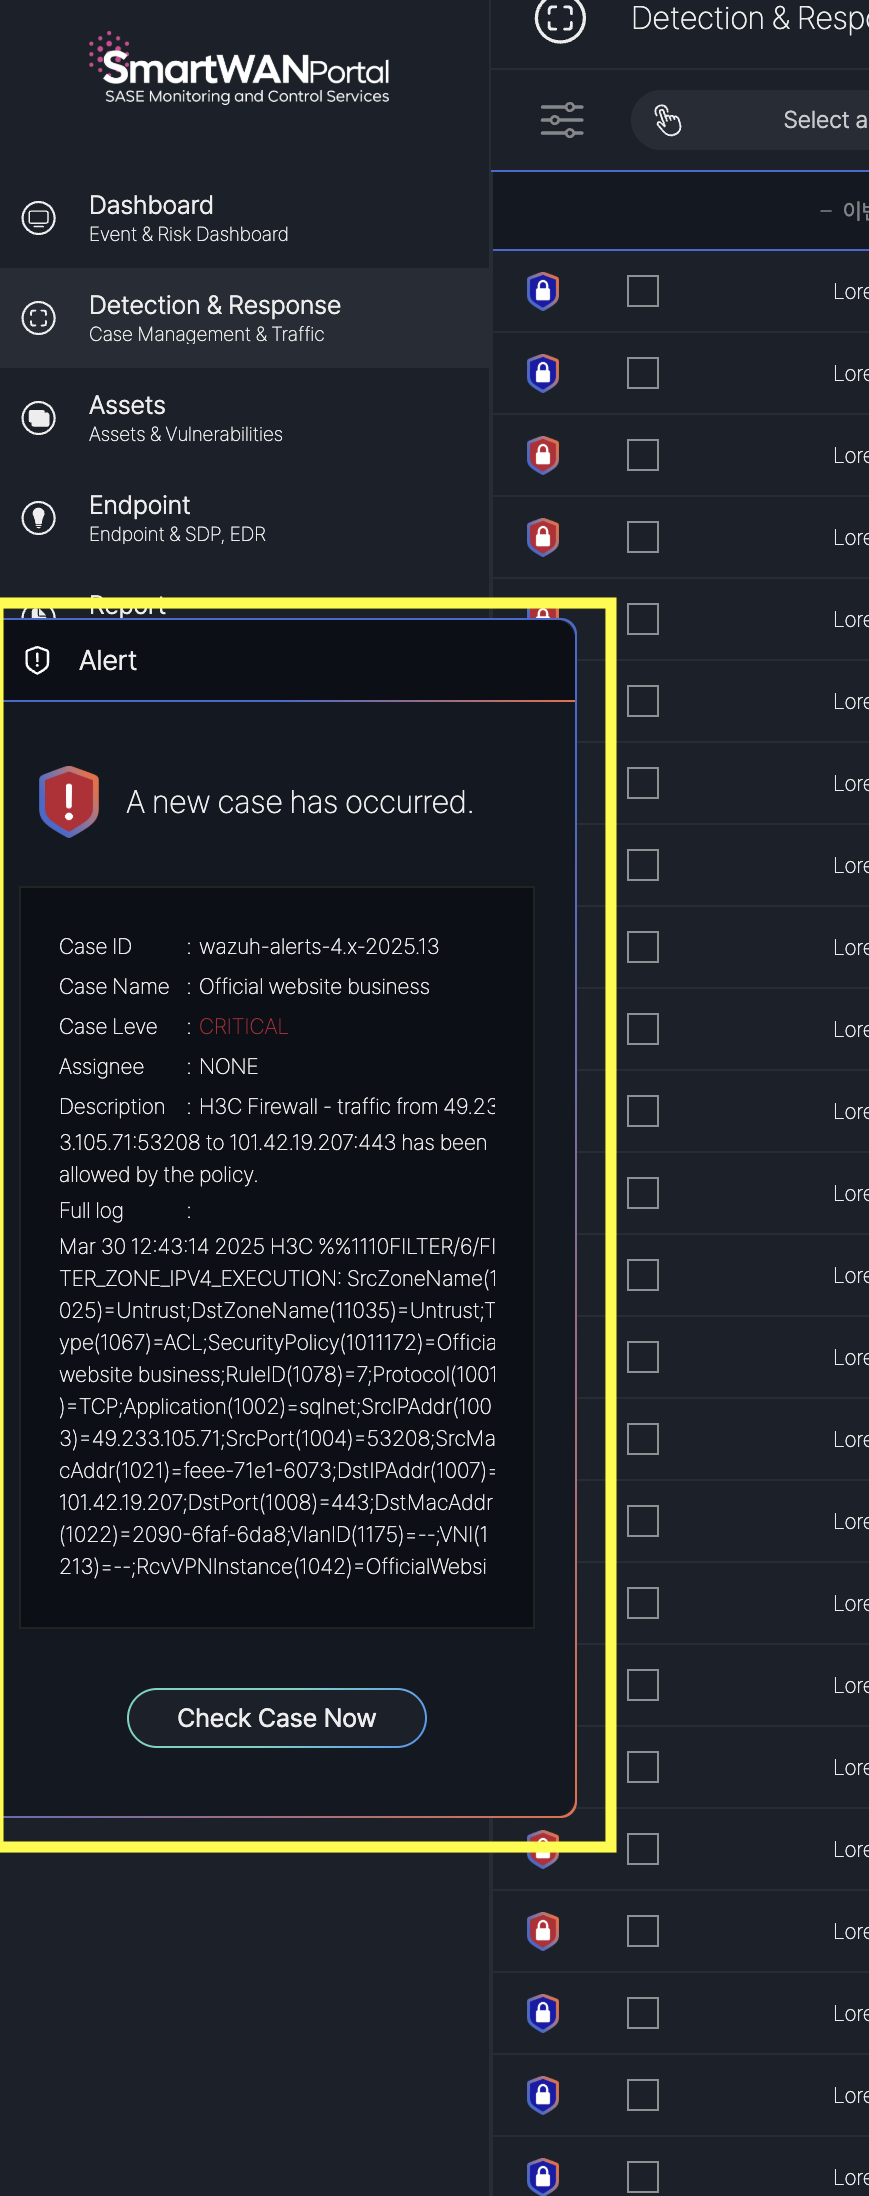
#### **Real-Time New Case Alert**
The SmartWAN Portal provides real-time notifications to alert users of new cases while they are actively using the platform. This feature ensures that users are promptly informed of critical incidents, allowing for immediate action to address potential threats.
[](https://book.weetizen.com/uploads/images/gallery/2025-04/o9iimage.png)
# Report
#### **Event Report**
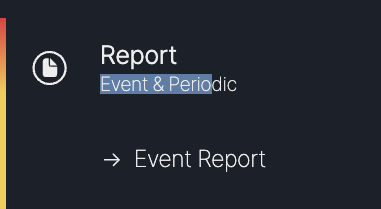
The Event Report menu can be found in the Report section of the left sidebar.
#### **Event Report List**
[](https://book.weetizen.com/uploads/images/gallery/2025-04/HSLimage.png)
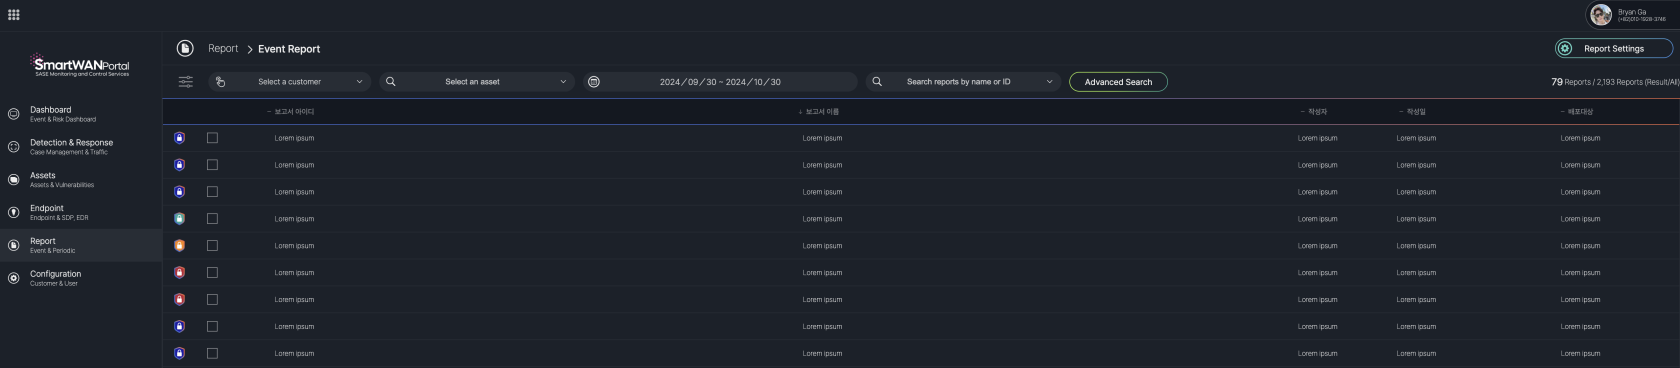
The **Event Report** menu in the SmartWAN Portal displays a list of generated reports for events.
Accessible under the "Report" section, it includes filters for selecting a customer, asset, and date range, a search bar for reports by name or ID, and an "Advanced Search" option.
#### **Event Report Details**
The **Event Report Detail Screen** in the SmartWAN Portal is displayed when a report is selected from the **Event Report** menu. It provides a comprehensive view of the report, organized into multiple sections accessible via tabs at the top of the screen.
| Tab Number | Section Name | Description |
|---|
| I | Overview | Provides a summary of the report, including title, ID, reporter, date, and analysis period. |
| II | Statistics | Displays statistical data related to the case, such as event counts and asset details. |
| III | Analysis | Details the analysis of the case, including root cause and impact assessment. |
| IV | Remediation | Outlines the remediation steps taken to resolve the incident. |
| V | Conclusion | Summarizes the outcomes and conclusions of the case response. |
| VI | Recommendations | Offers recommendations to prevent similar cases in the future. |
- **Report Title**: Indicates the main subject or focus of the report, providing a clear identifier for the incident or analysis.
- **Report ID**: A unique identifier assigned to the report for tracking and reference purposes within the system.
- **Reported By**: Identifies the user who generated the report, including their contact information for accountability and follow-up.
- **Report Date**: Specifies the date and time when the report was finalized, helping to establish a timeline for the incident response.
- **Analysis Period**: Defines the time range during which the incident was analyzed, providing context for the duration of the event and response efforts.
- **Distribution Target**: Lists the individuals, teams, or roles to whom the report is distributed, ensuring relevant stakeholders are informed.
- **Summary**: Offers a high-level overview of the incident, including key findings, the nature of the threat, and its impact, to provide a quick understanding of the situation.
- **Related Elements**: Presents statistical data in visual form (e.g., pie charts) to show the distribution of events by severity and the types of assets affected, aiding in understanding the scope and impact of the incident.
##### **II. Statistics**
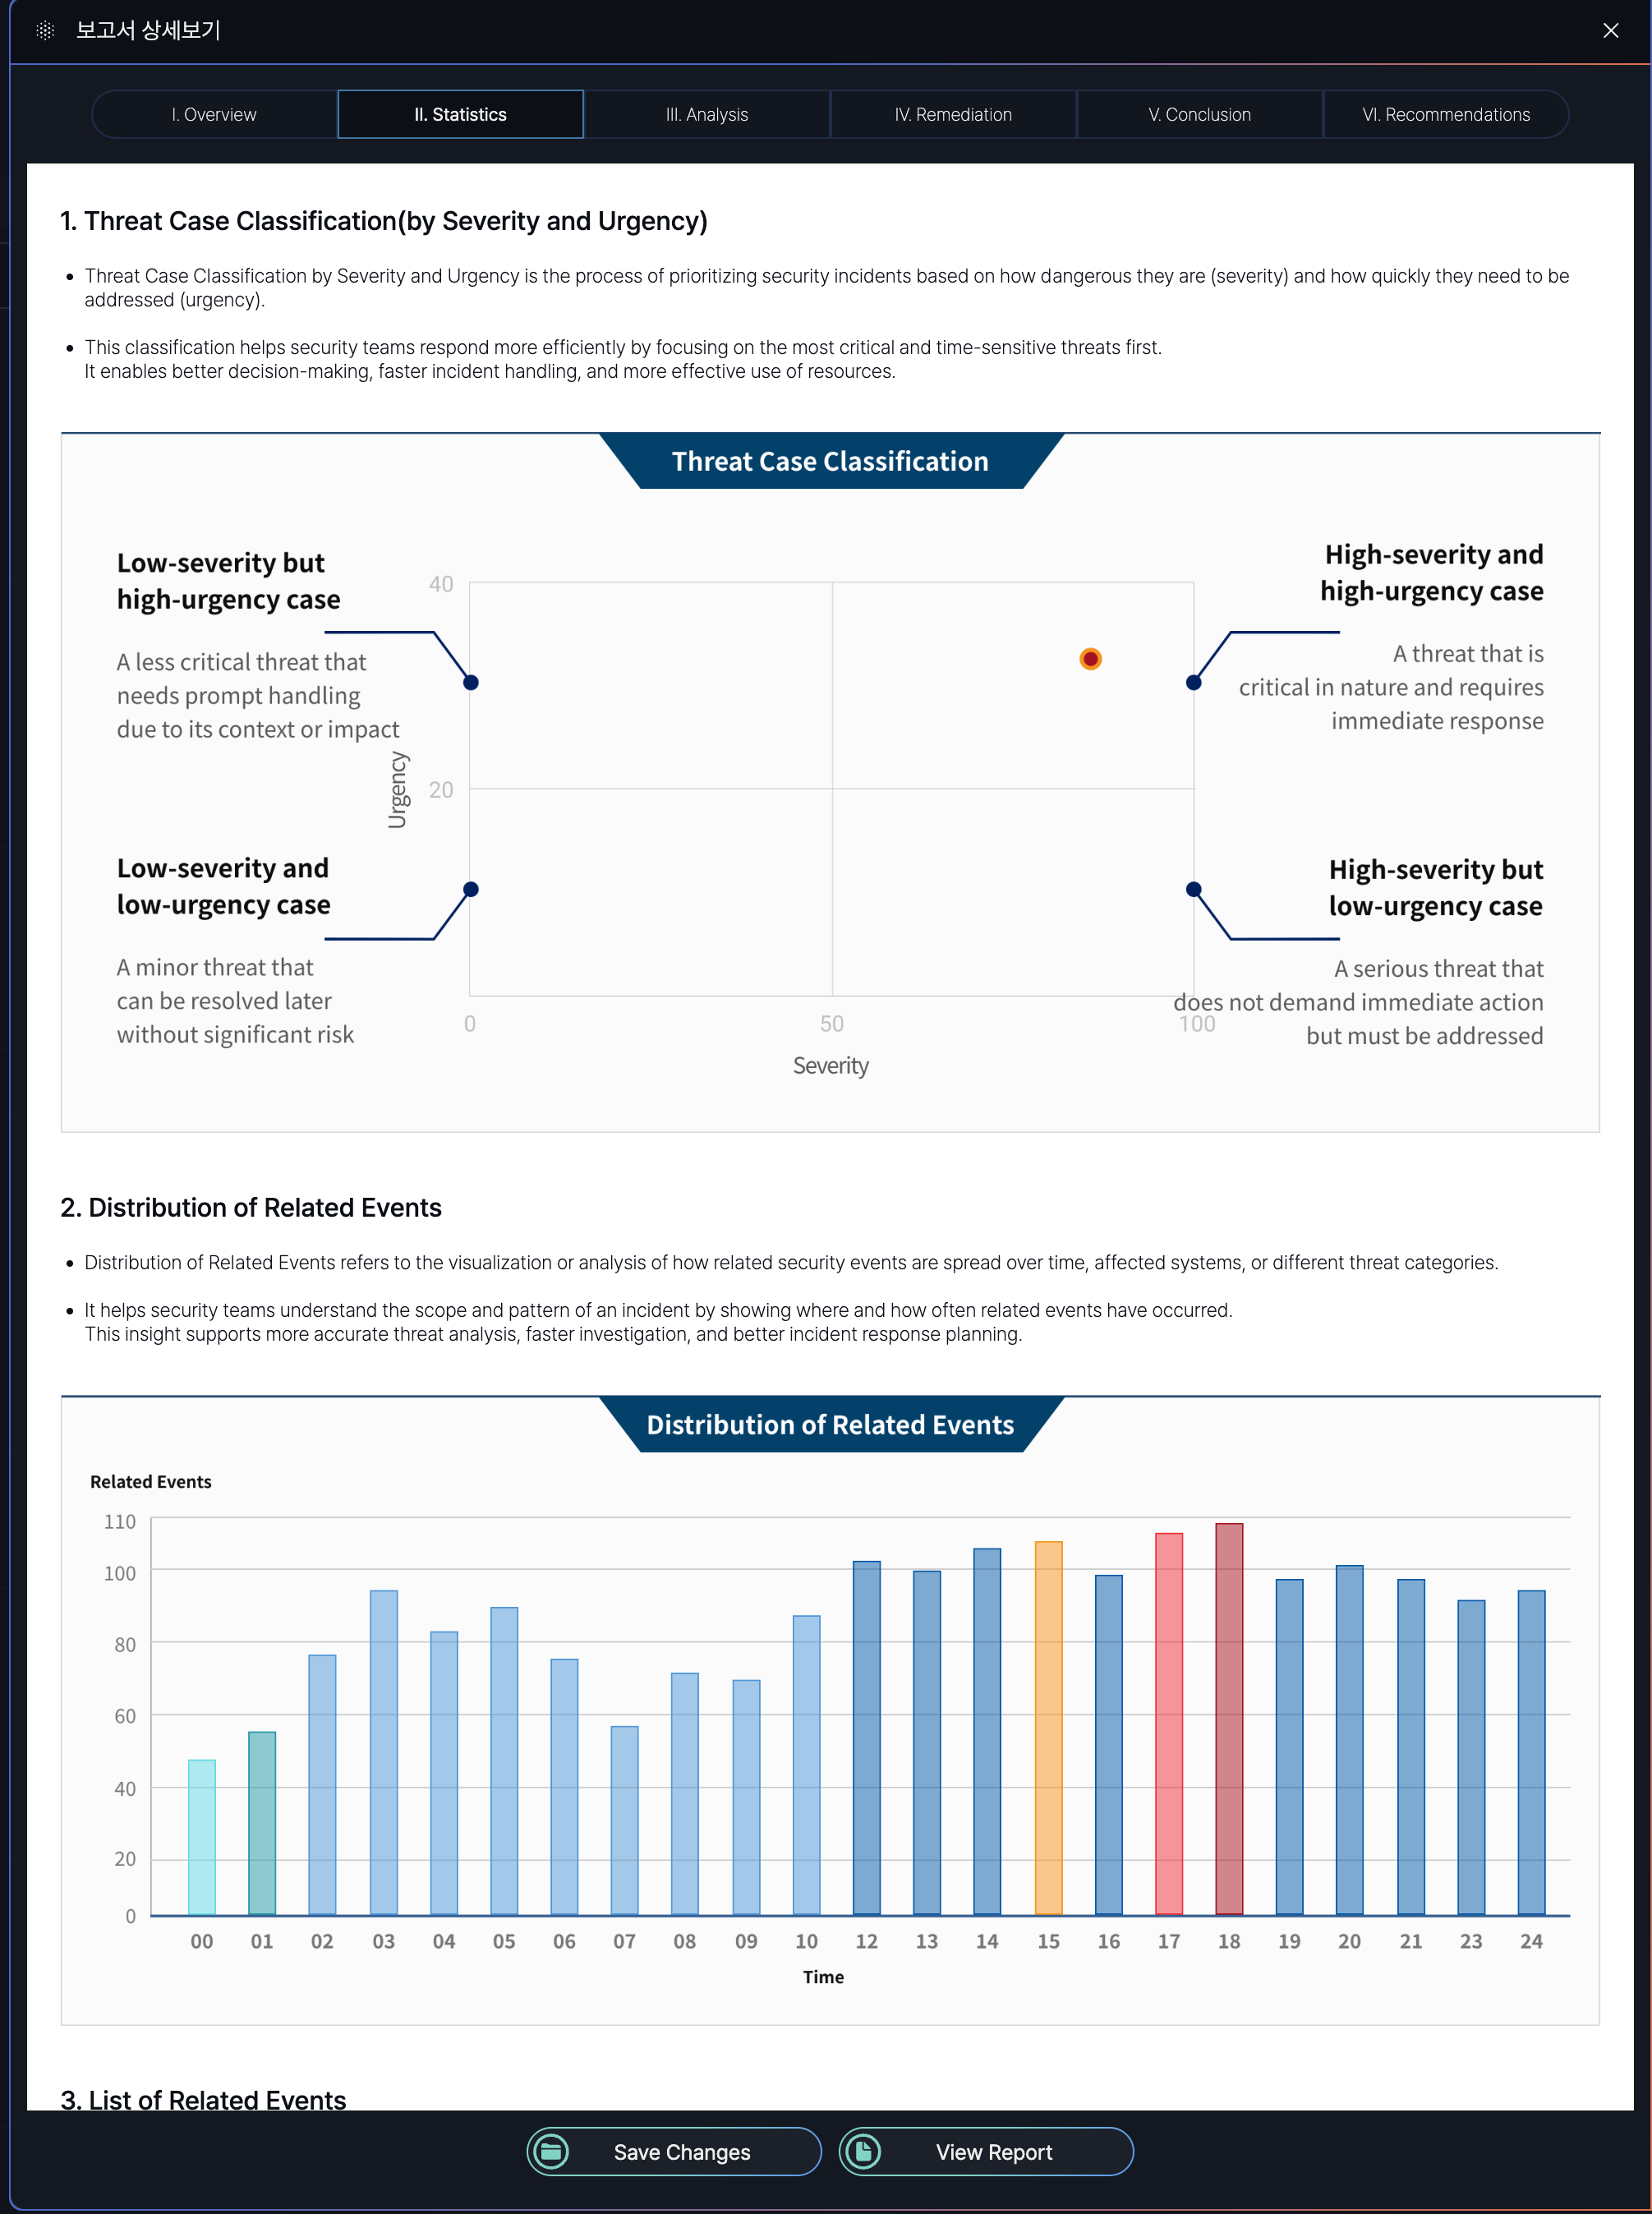
The **Statistics** tab (II) in the **Event Report Detail Screen** of the SmartWAN Portal provides statistical insights into the incident, helping users understand the severity, urgency, and distribution of related events.
[](https://book.weetizen.com/uploads/images/gallery/2025-04/Zfvimage.png)
This image displays a partial section of the complete report.
---
**Statistics Report Summary**
| **Section** | **Purpose** | **Key Details** |
|---|
| **Threat Case Classification** | Prioritizes security cases based on severity and urgency. | - **Severity**: Measures threat danger (Low/High).
- **Urgency**: Measures response time needed (Low/High).
- **Matrix**: Combines both (e.g., High Severity + High Urgency = Critical). |
| **Distribution of Related Events** | Visualizes how related security events spread across time/systems. | - Tracks event frequency and patterns.
- Aids in identifying attack scope and hotspots. |
| **List of Related Events** | Groups events with shared attributes to uncover attack sequences. | **Grouping Criteria**:
- **Common Indicators**: Shared IPs, users, devices.
- **Time Correlation**: Events in close proximity.
- **Attack Patterns**: Matches MITRE ATT&CK tactics.
- **Behavior Analysis**: Suspicious chains (e.g., file execution → external connection).
- **Threat Intelligence**: Matches known IOCs. |
---
**Threat Case Classification Matrix**
| **Severity \\ Urgency** | **Low Urgency** | **High Urgency** |
|---|
| **Low Severity** | Minor threat; resolve later. | Less critical but needs prompt handling. |
| **High Severity** | Serious threat; no immediate action. | Critical; requires immediate response. |
---
**Key Takeaways**
1. **Prioritization**: Clear severity/urgency tiers streamline incident response.
2. **Pattern Analysis**: Distribution and event grouping reveal attack trends.
3. **Correlation**: Multi-criteria linking (time, behavior, IOCs) enhances threat detection.
##### **III. Analysis**
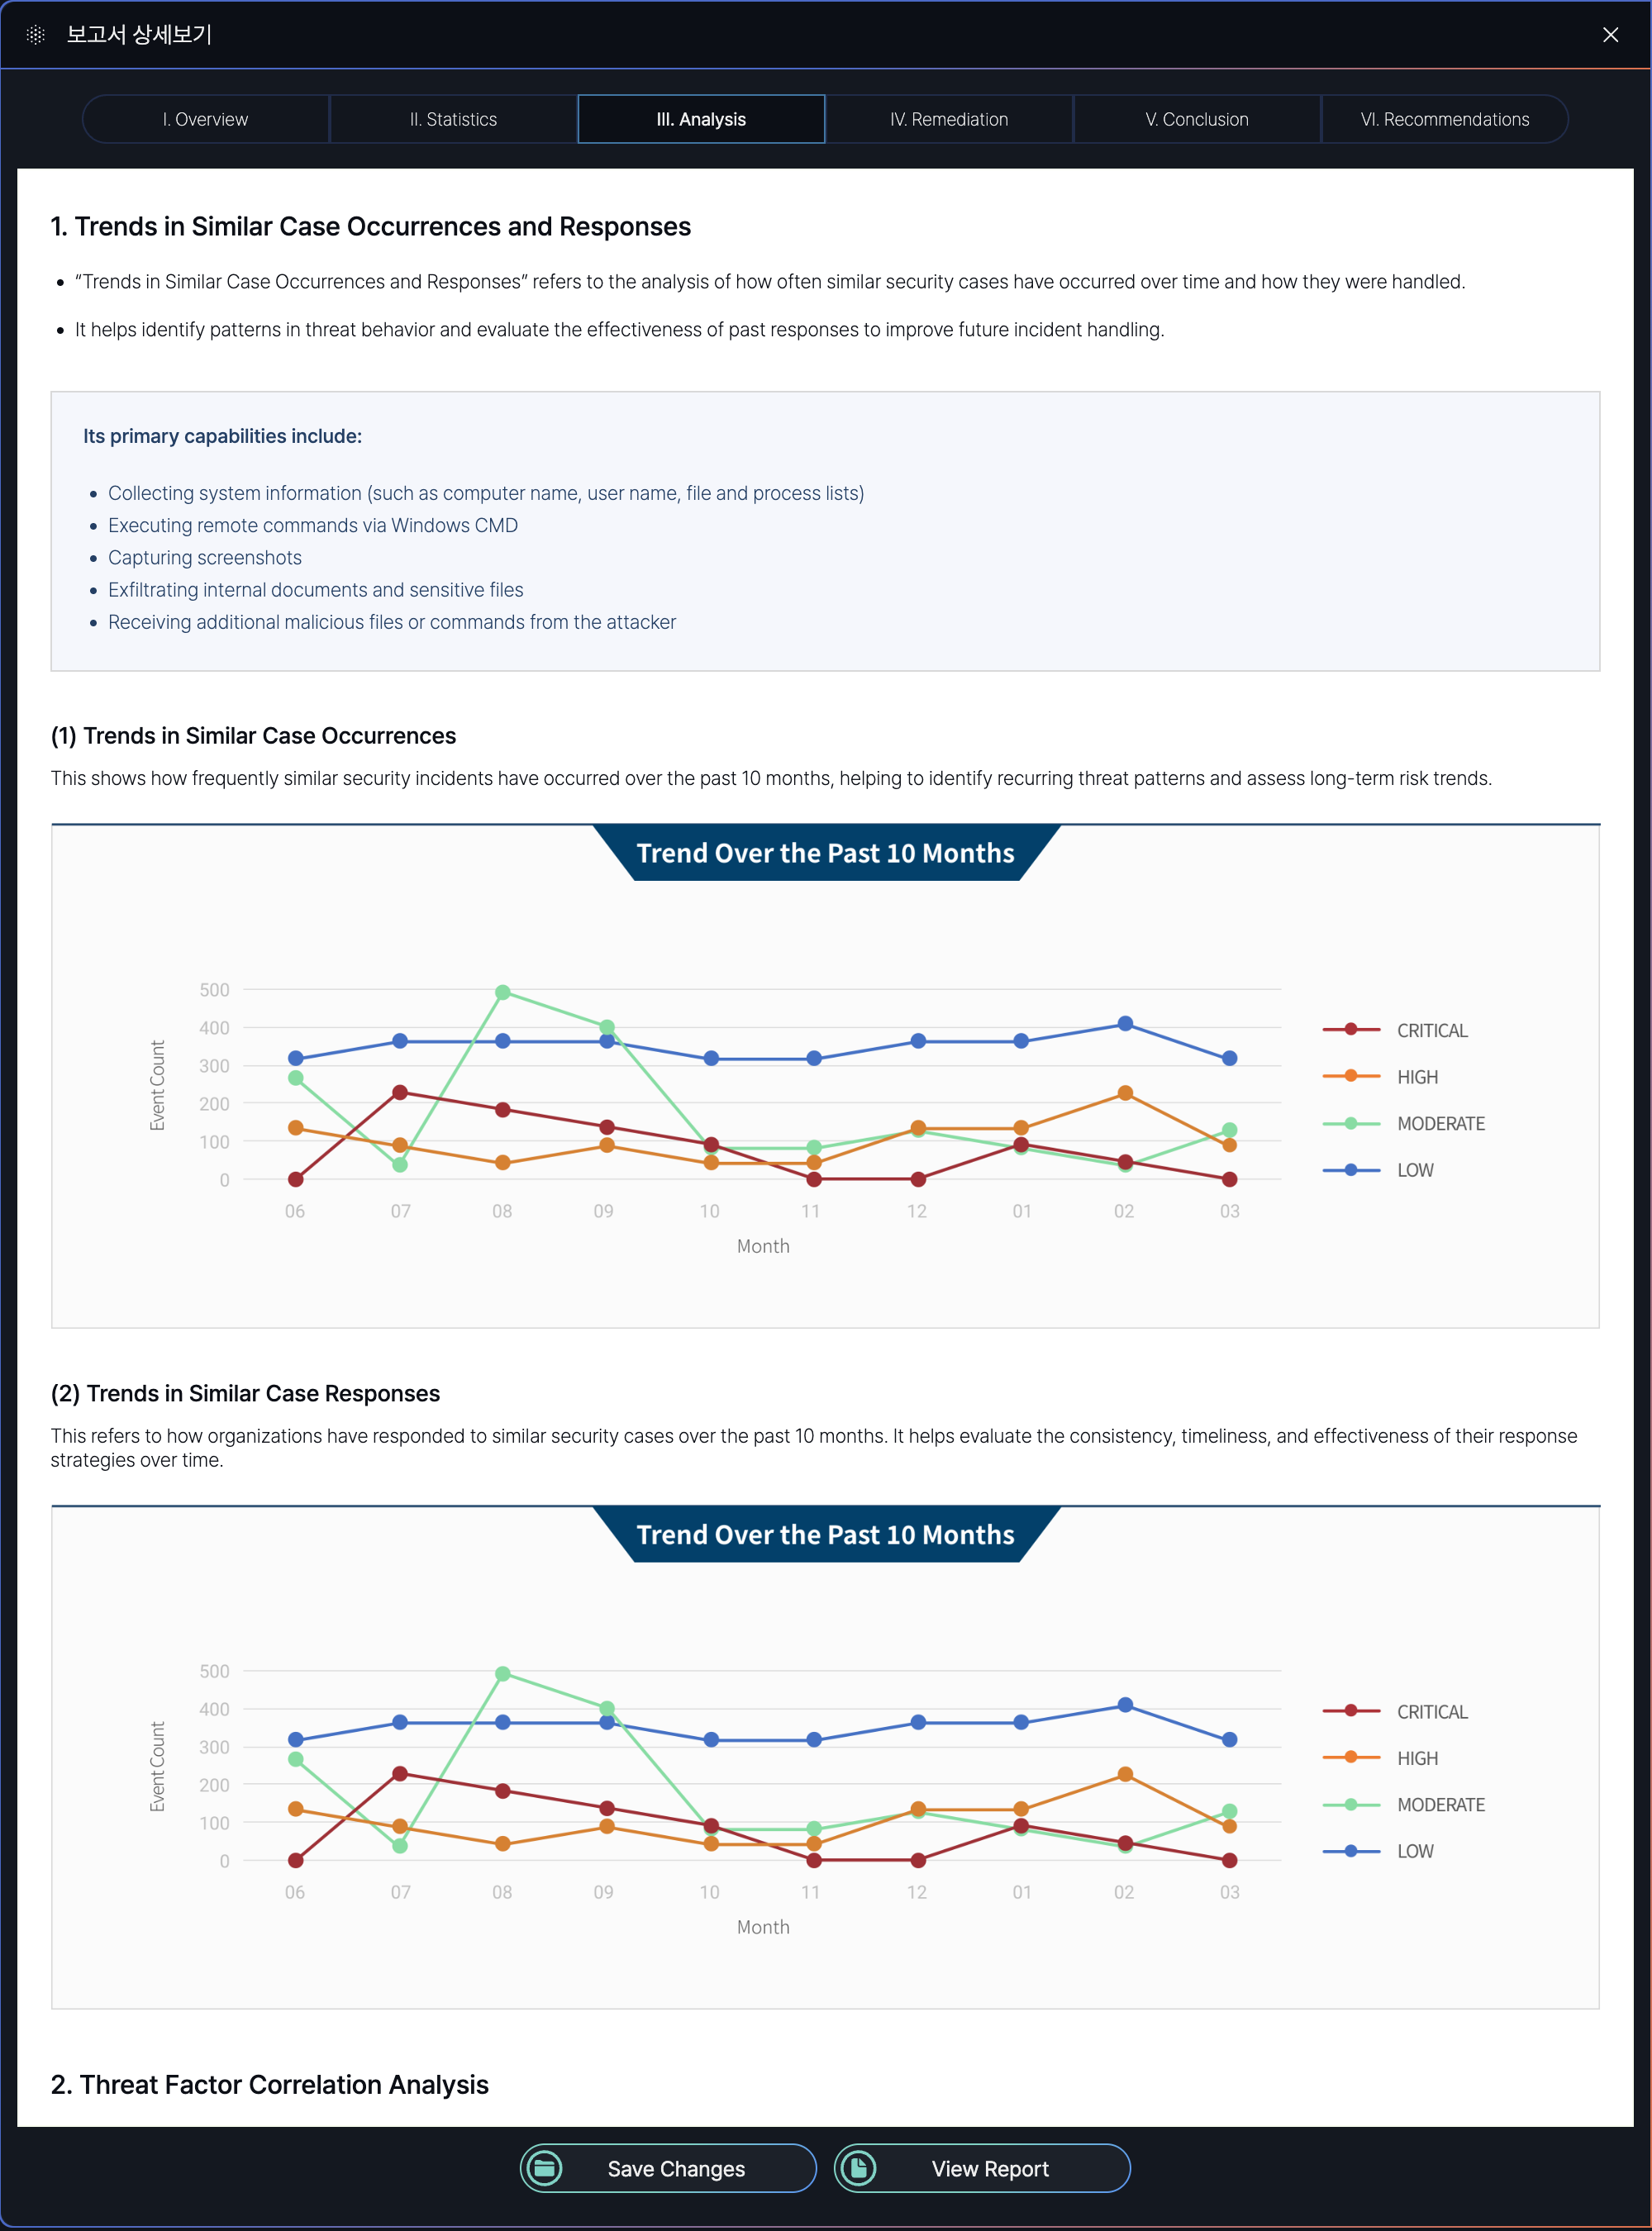
The Analysis tab (III) in the Event Report Detail Screen of the SmartWAN Portal provides in-depth **threat pattern analysis**, **response effectiveness, and correlations between threat factors.**
[](https://book.weetizen.com/uploads/images/gallery/2025-04/btmimage.png)
This image displays a partial section of the complete report.
**Threat in Similar Case Occurrences and Responses**
| **Section** | **Purpose** | **Key Details** |
|---|
| **Threat in Similar Case Occurrences** | Analyzes the frequency and severity of past security threats over a specified period. | - Tracks threat patterns (e.g., monthly trends).
- Visualizes data to identify critical/high-risk periods. |
| **Threat in Similar Case Responses** | Evaluates the effectiveness of organizational responses to past threats. | - Assesses response strategies (e.g., speed, methods).
- Identifies areas for improvement. |
---
**Threat Factor Correlation Analysis**
| **Section** | **Purpose** | **Key Details** |
|---|
| **Threat Level Distribution of Related Factors** | Maps the severity levels (Critical/High/Moderate/Low) of linked threat factors. | - Highlights high-risk elements (e.g., IPs, users).
- Aids in prioritizing response actions. |
| **Probability Distribution of Risk Levels** | Quantifies the likelihood of each risk level occurring among correlated factors. | - Uses statistical analysis (e.g., "60% Moderate risk").
- Supports predictive threat assessment. |
**Correlation Rules**: Time-based or entity-based logic is applied to detect complex attack patterns.
**Threat Scores**: Calculated based on severity, context, and threat intelligence to guide decision-making.
##### **IV. Remediation**
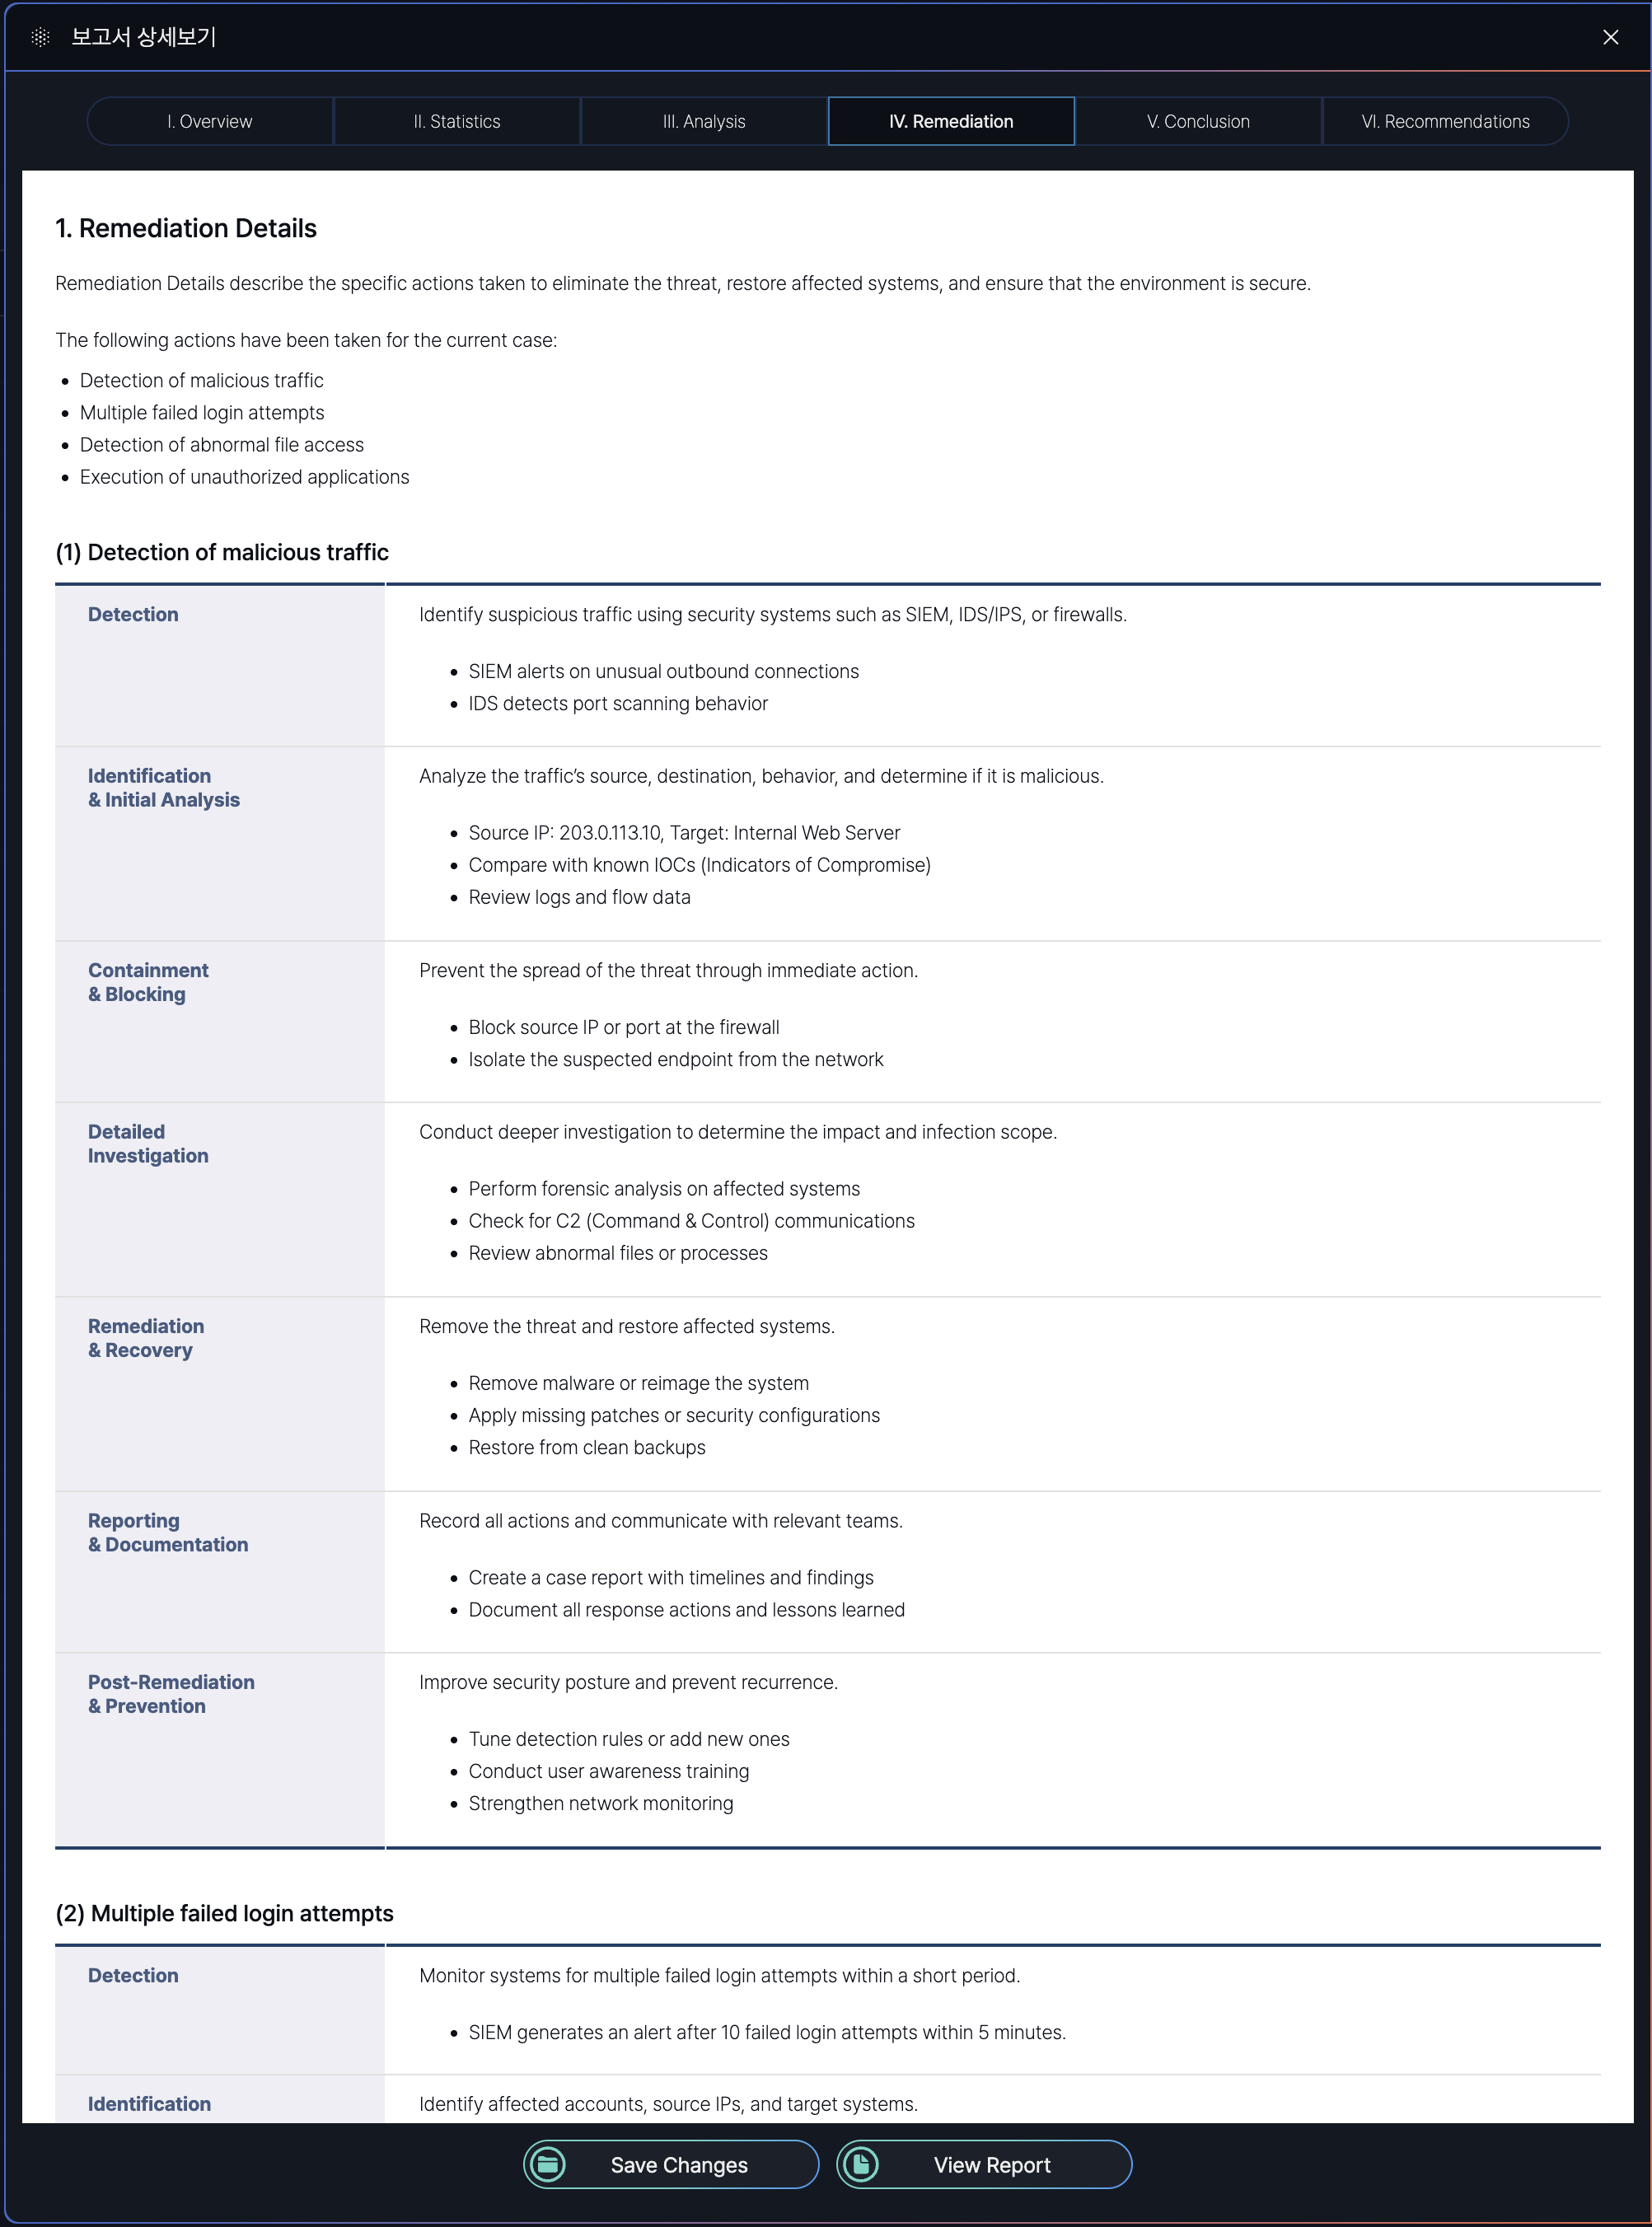
Remediation tab (IV) in the Event Report Detail Screen of the SmartWAN Portal provides **threat mitigation actions**, including detection, containment, recovery, and preventive measures for resolved security cases.
[](https://book.weetizen.com/uploads/images/gallery/2025-04/vkuimage.png)
**Remediation Report Section**
| **Section** | **Purpose** | **Explanation** |
|---|
| **Detection of Malicious Traffic** | Identify and analyze suspicious network activities | Uses SIEM/IDS to detect anomalies like port scanning or unusual connections. |
| **Multiple Failed Login Attempts** | Prevent brute-force attacks and unauthorized access | Monitors repeated login failures, locks accounts, blocks suspicious IPs, and enforces stronger authentication (e.g., MFA). |
| **Detection of Abnormal File Access** | Protect sensitive data from unauthorized access or exfiltration | Alerts on unusual file access patterns (e.g., mass downloads). Includes user verification and role-based access reviews. |
| **Execution of Unauthorized Applications** | Block potentially harmful software execution | Detects unapproved apps (e.g., TeamViewer), terminates processes, and enforces app control policies (e.g., allowlisting). |
##### **V. Conclusion**
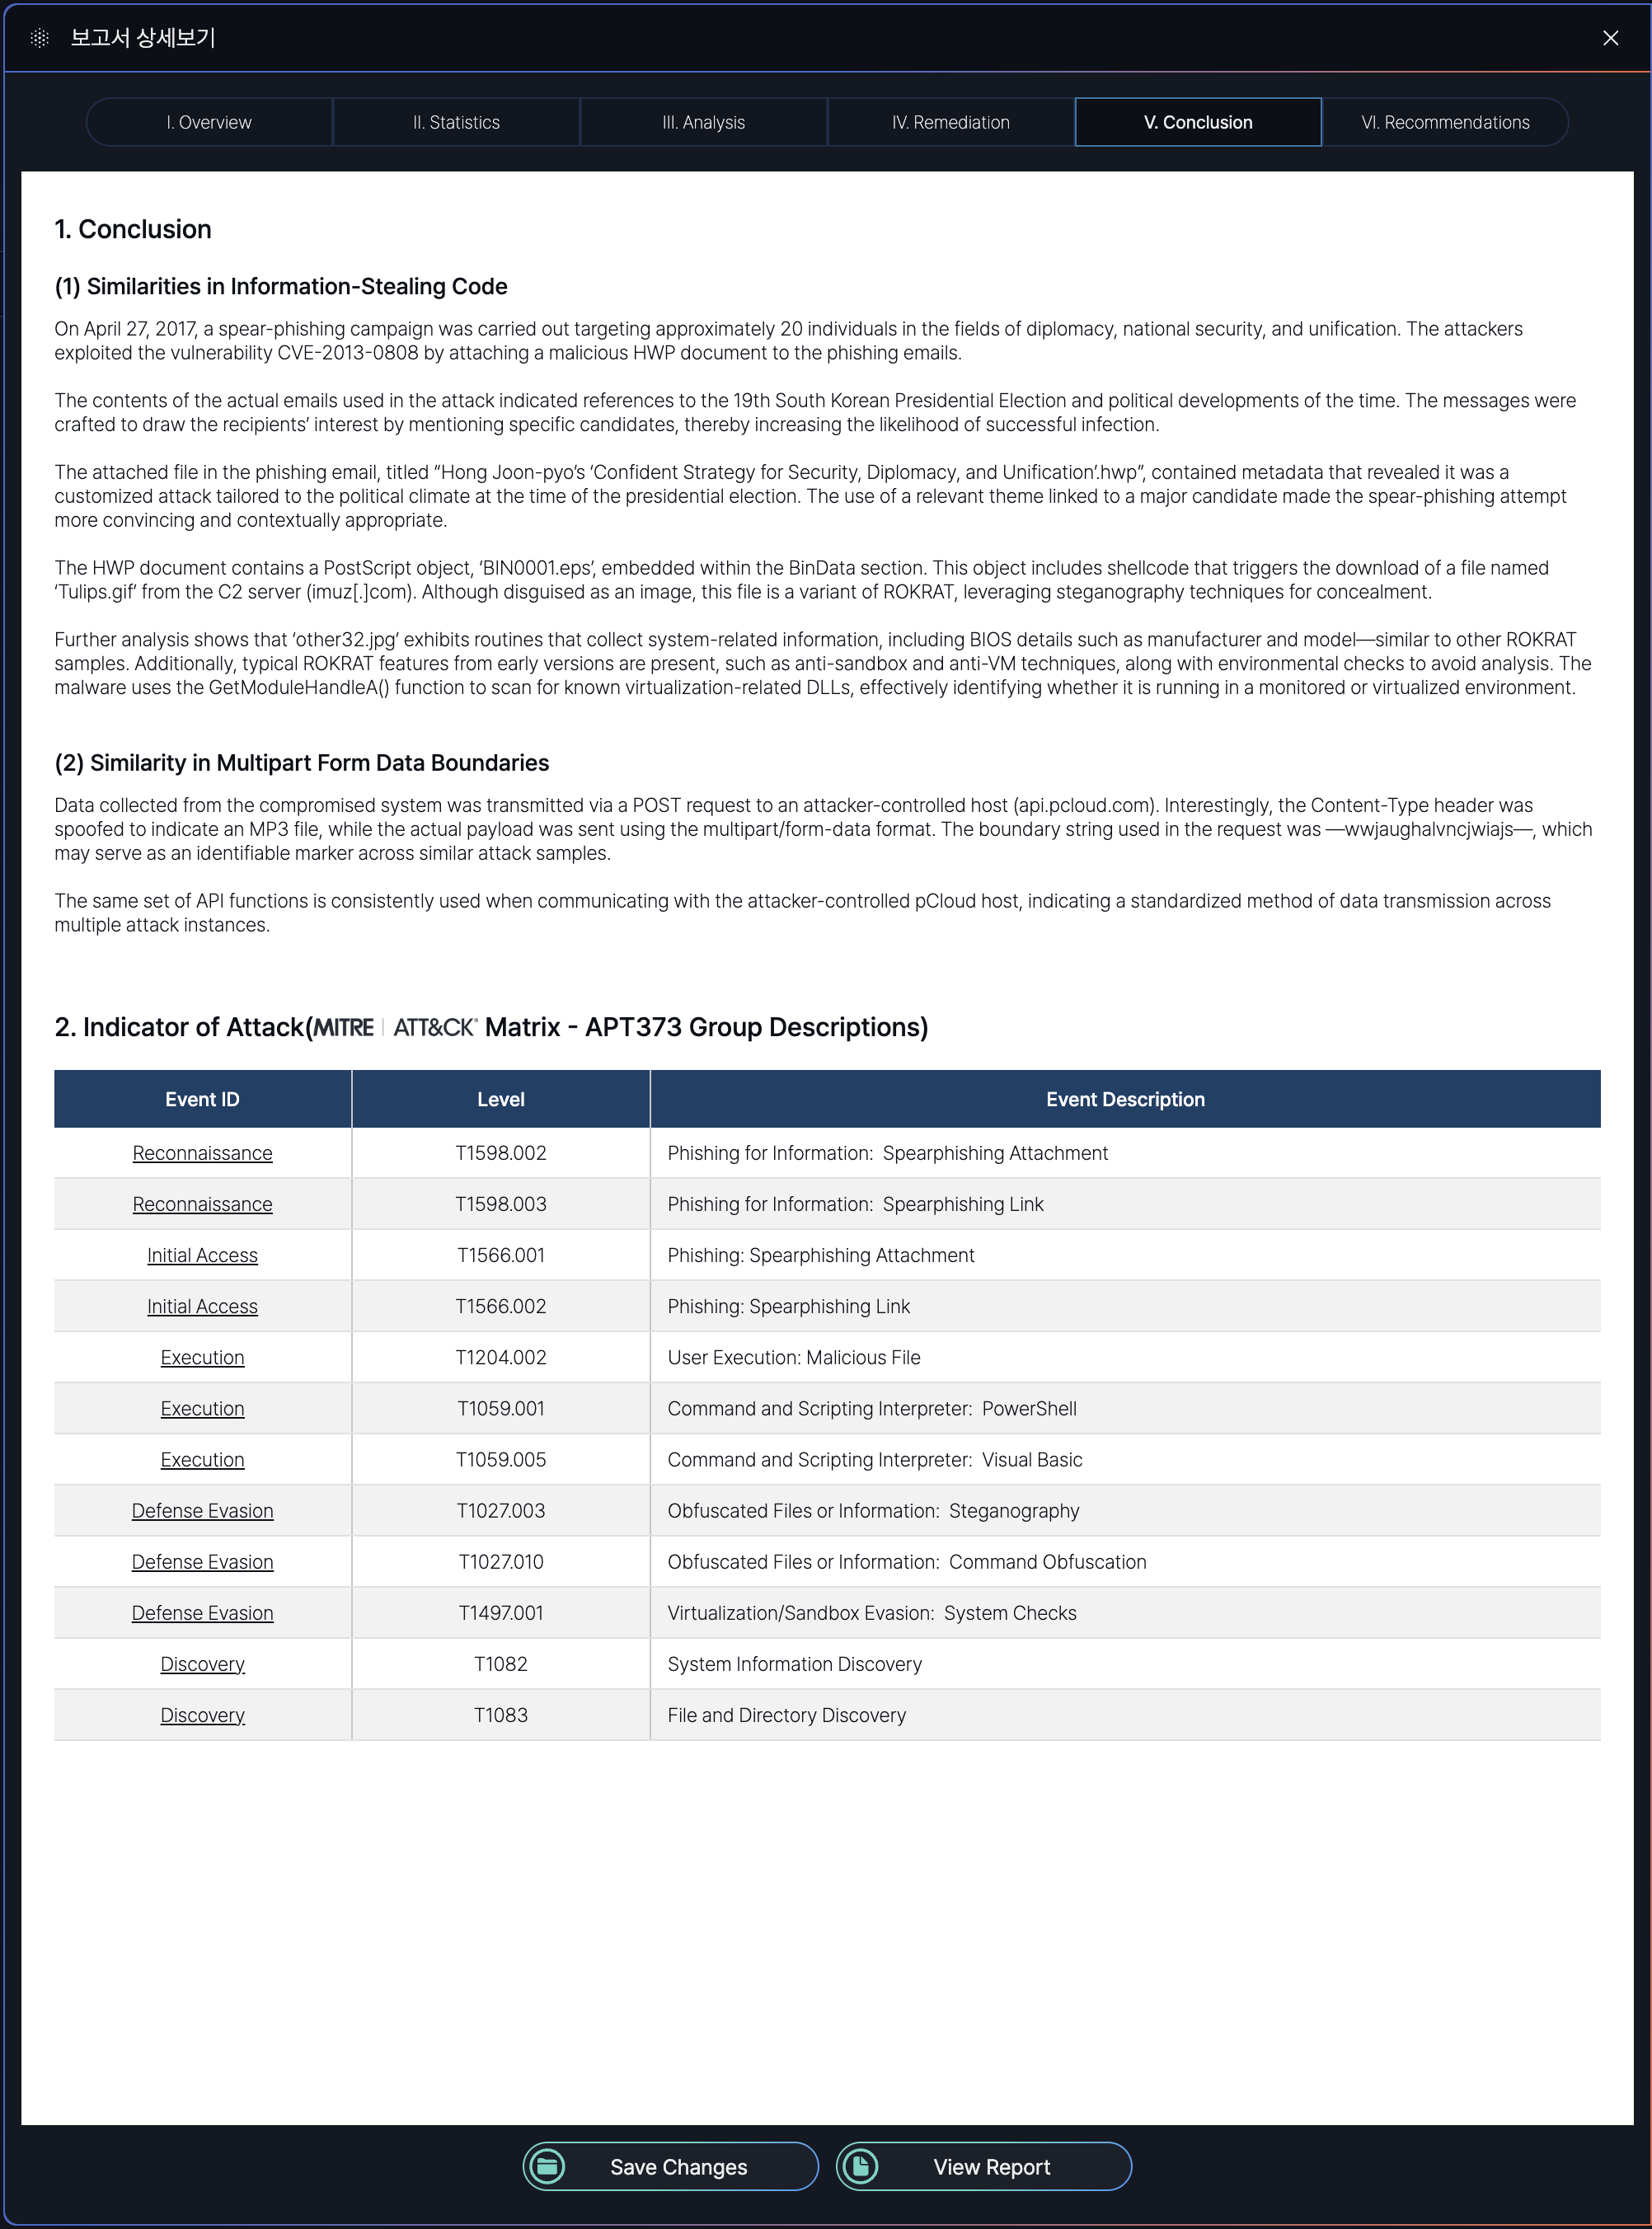
The Conclusion tab (V) in the Event Report Detail Screen of the SmartWAN Portal provides a synthesis of key findings about cases and indicators of attack.
[](https://book.weetizen.com/uploads/images/gallery/2025-04/SjTimage.png)
**Section Overview**
| **Section** | **Purpose** | **Explanation** |
|---|
| **Conclusion** | To synthesize key findings about cases. | Provides a high-level analysis of similarities in attack methods (e.g., code reuse, C2 communication) to link incidents to known threat actors or campaigns. Helps analysts identify operational patterns. |
| **Indicator of Attack** | To map observed tactics to standardized frameworks for threat categorization and response planning. | Aligns attack techniques (e.g., spearphishing, steganography) with MITRE ATT&CK tactics (e.g., T1566.001). Enables defenders to prioritize mitigations based on proven threat models. |
##### **VI. Recommendations**
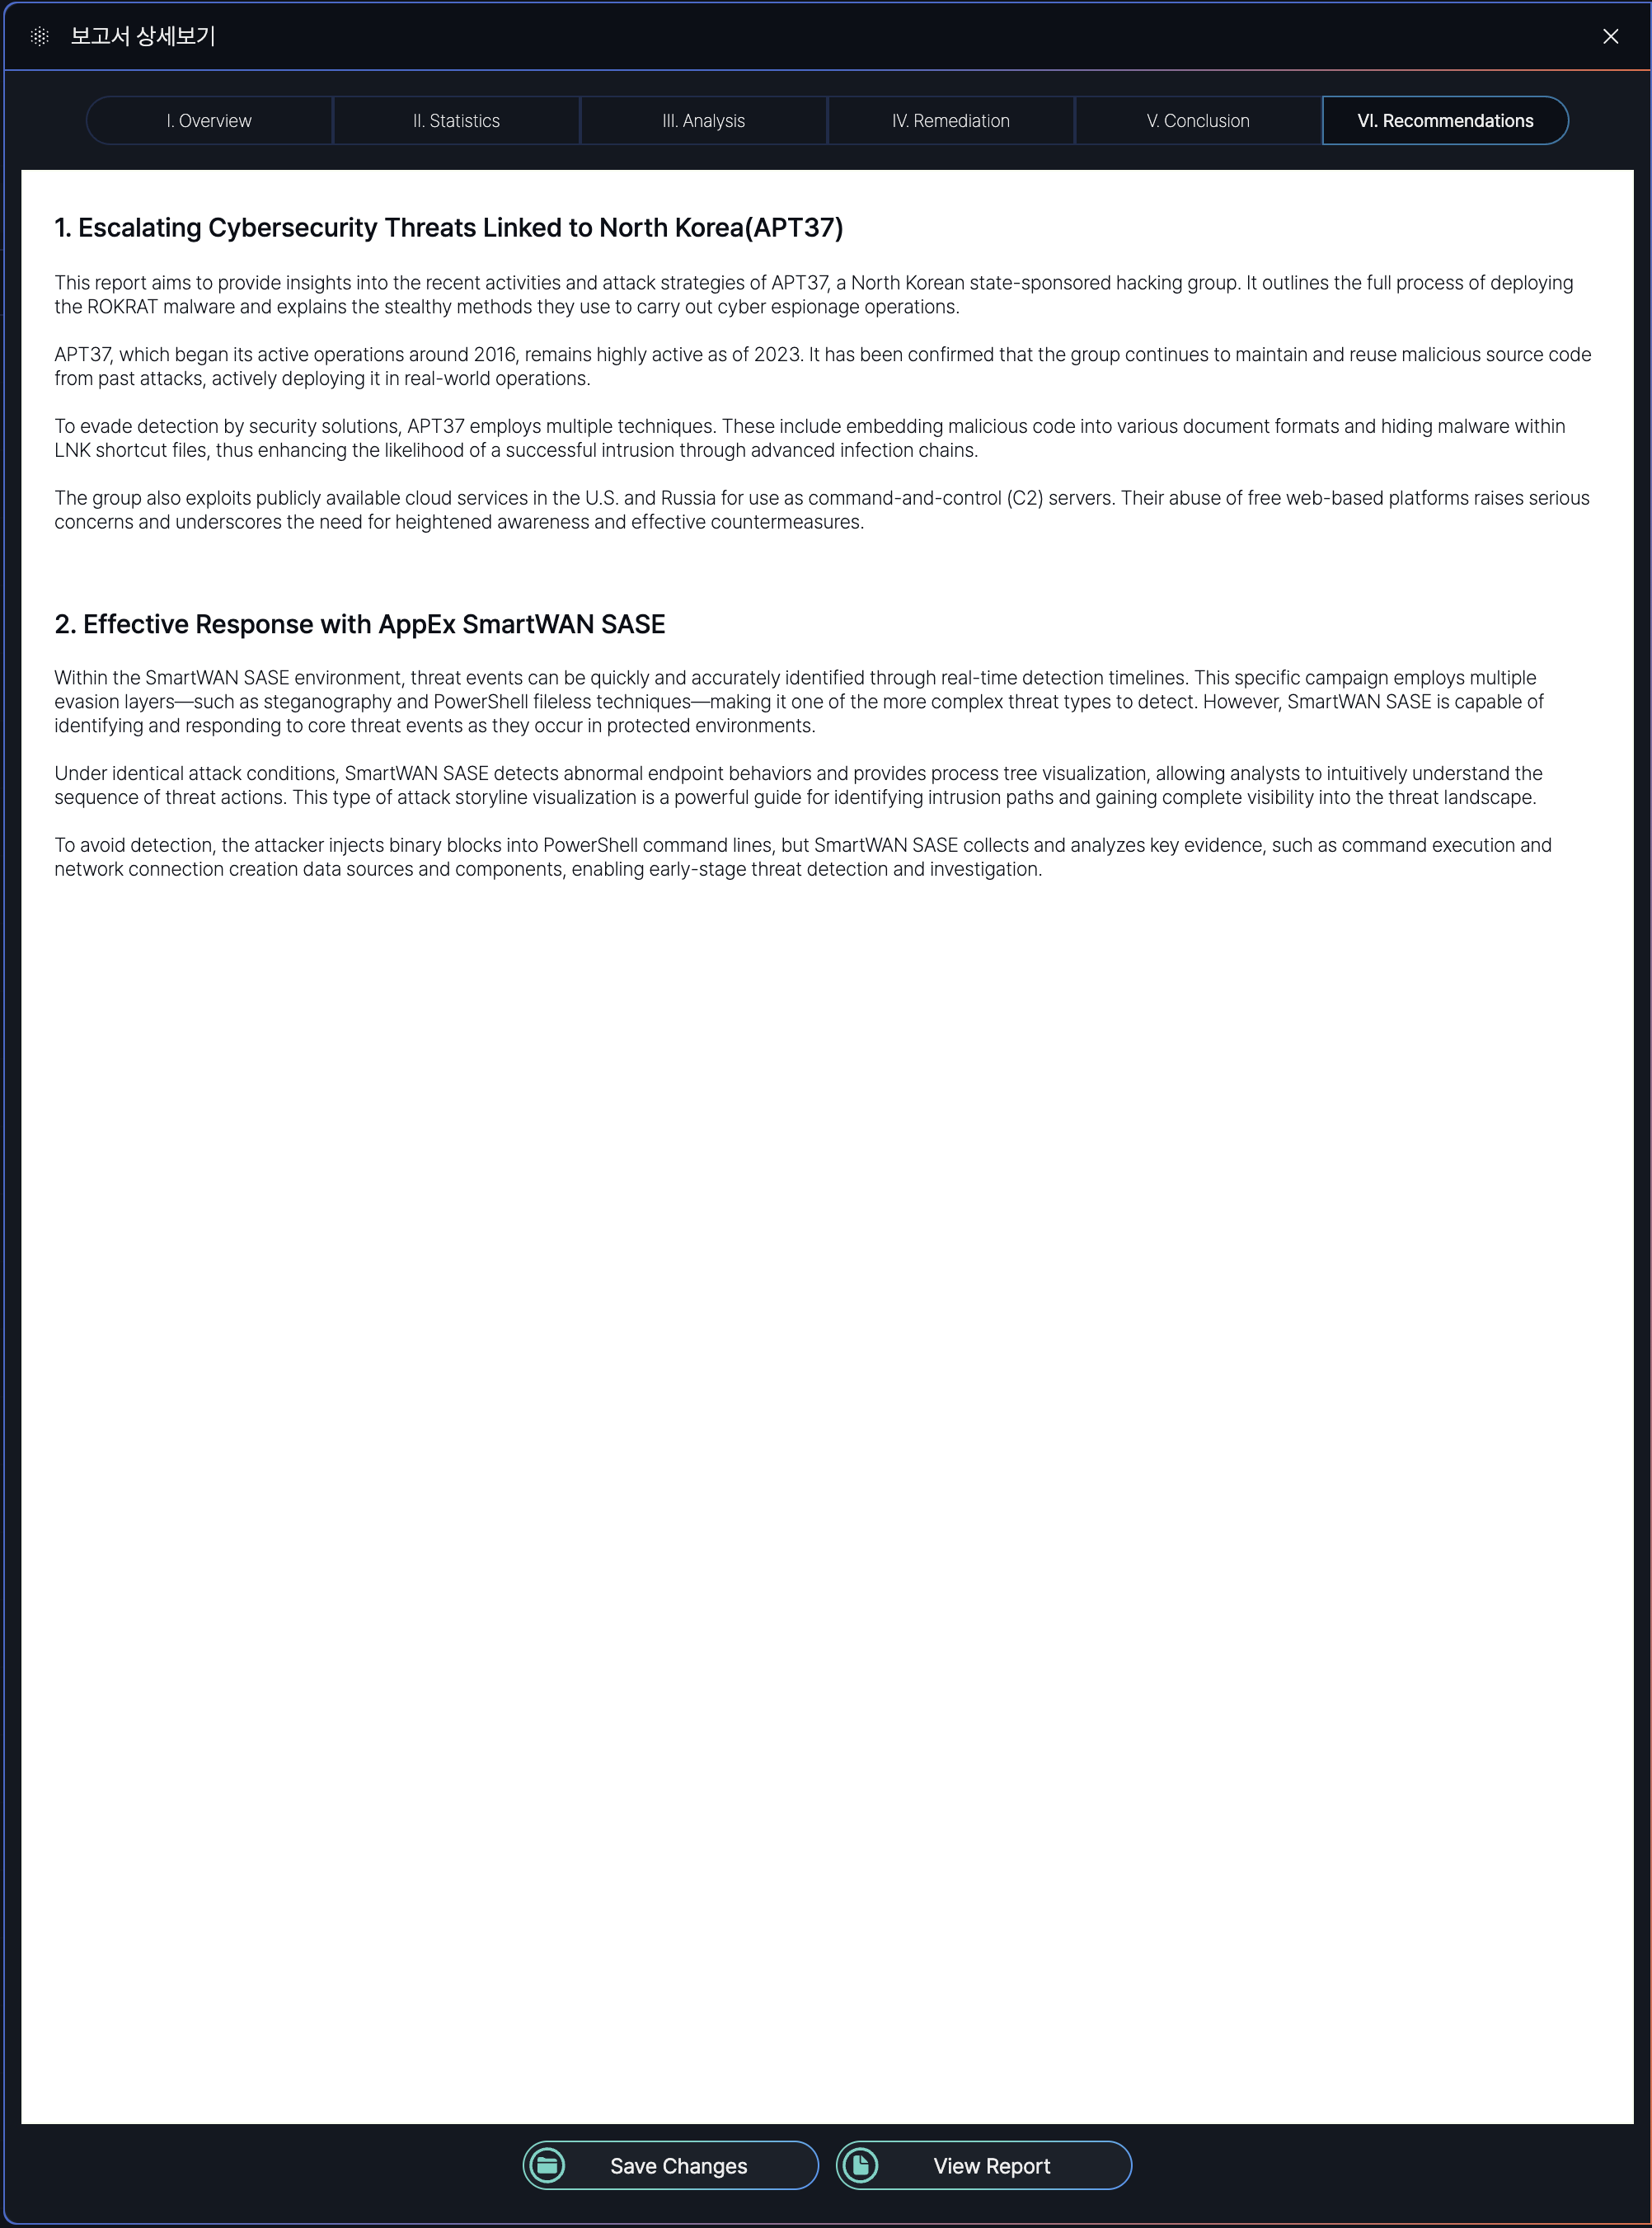
The **Recommendations** tab (VI) is the final section of the **Event Report Detail Screen** in the SmartWAN Portal.
This tab provides actionable suggestions and best practices to prevent similar incidents in the future. It focuses on improving security measures, addressing vulnerabilities, and enhancing response strategies based on the incident analysis.
[](https://book.weetizen.com/uploads/images/gallery/2025-04/VQBimage.png)
A sample PDF file of the Event Report described in this guide is available for download. You can access the full report, including all sections (Overview, Statistics, Analysis, Remediation, Conclusion, and Recommendations).
Sample PDF download: [ANRN-00936.pdf](https://appexnetworksadmin.sharepoint.com/:b:/s/AppExKR/EYg4U4vaESBJhCNcILFycwYBMOBfQ211Z2u7zPdEeMeHxQ?e=URy1w2) (APPEX Networks user only)