Dashboard
Getting Started
Logging In with an Accessible User Account
To begin, log in using a user account with access privileges.
You can find more options for user authentication.
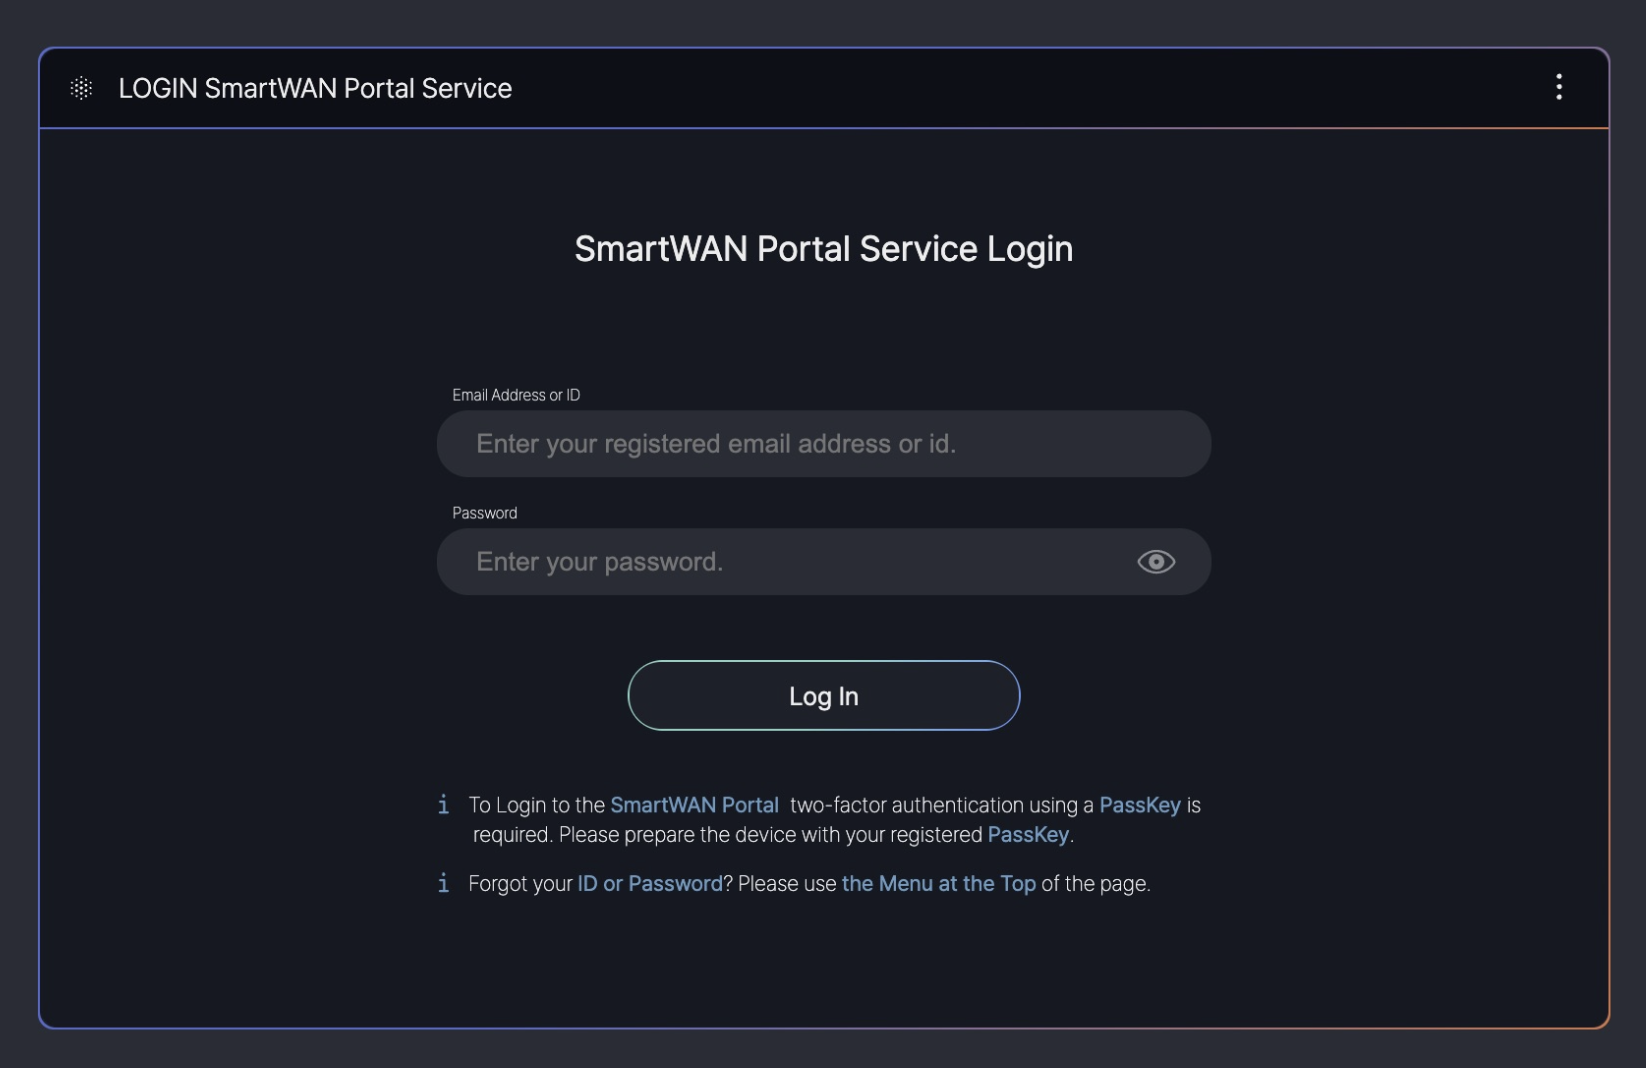
This guide is based on SKT’s SmartWAN Portal. Updates will be continuously applied to reflect future changes.
Pre-Configured Dashboards
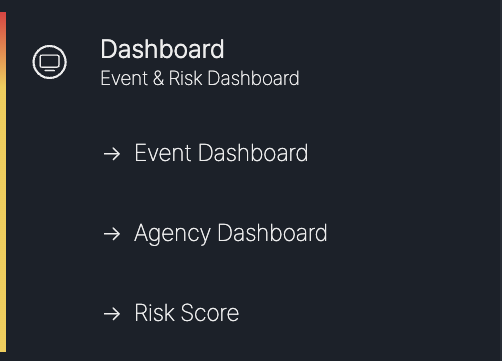
Currently, the dashboards are configured for the monitoring purposes of SKT’s agency SmartWAN system.
Event Dashboard (under development)
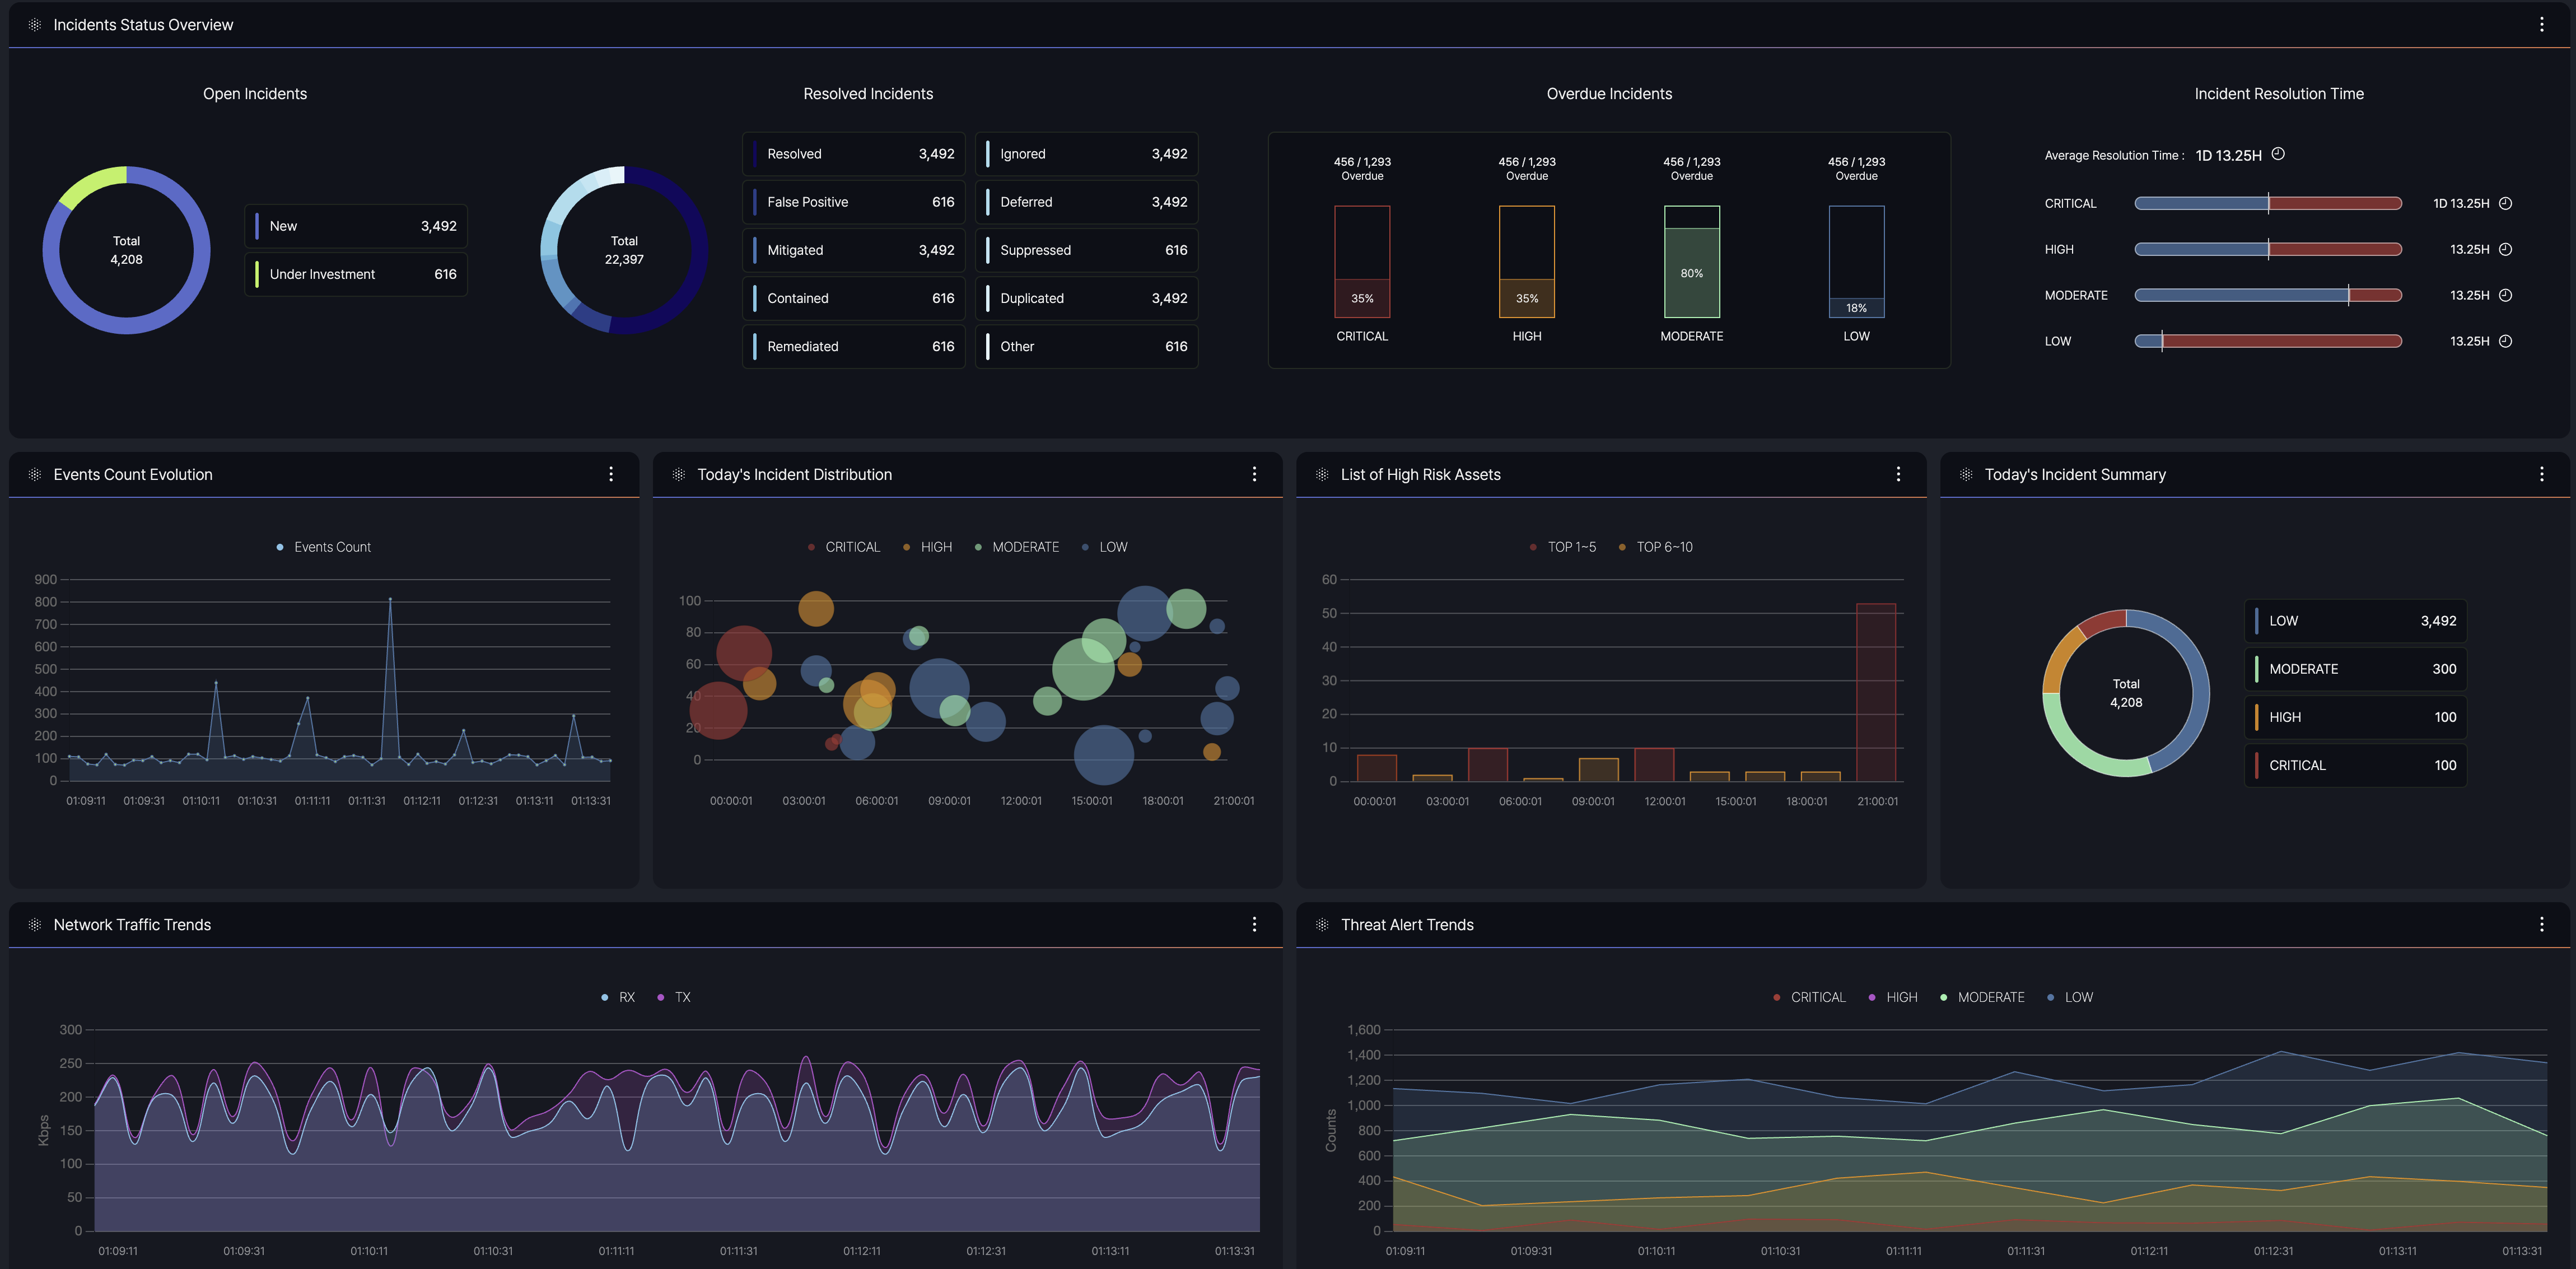
- Purpose: Provides a centralized view of security and network event data, enabling users to monitor and manage incidents effectively.
- Data Sources: Integrates information from multiple origins, including agents, agentless systems, and external feeds.
- Key Information: Displays summaries of event counts, severity levels, and current statuses to facilitate quick decision-making.
Agency Dashboard
- Agency monitoring
- System monitoring

Agency monitoring
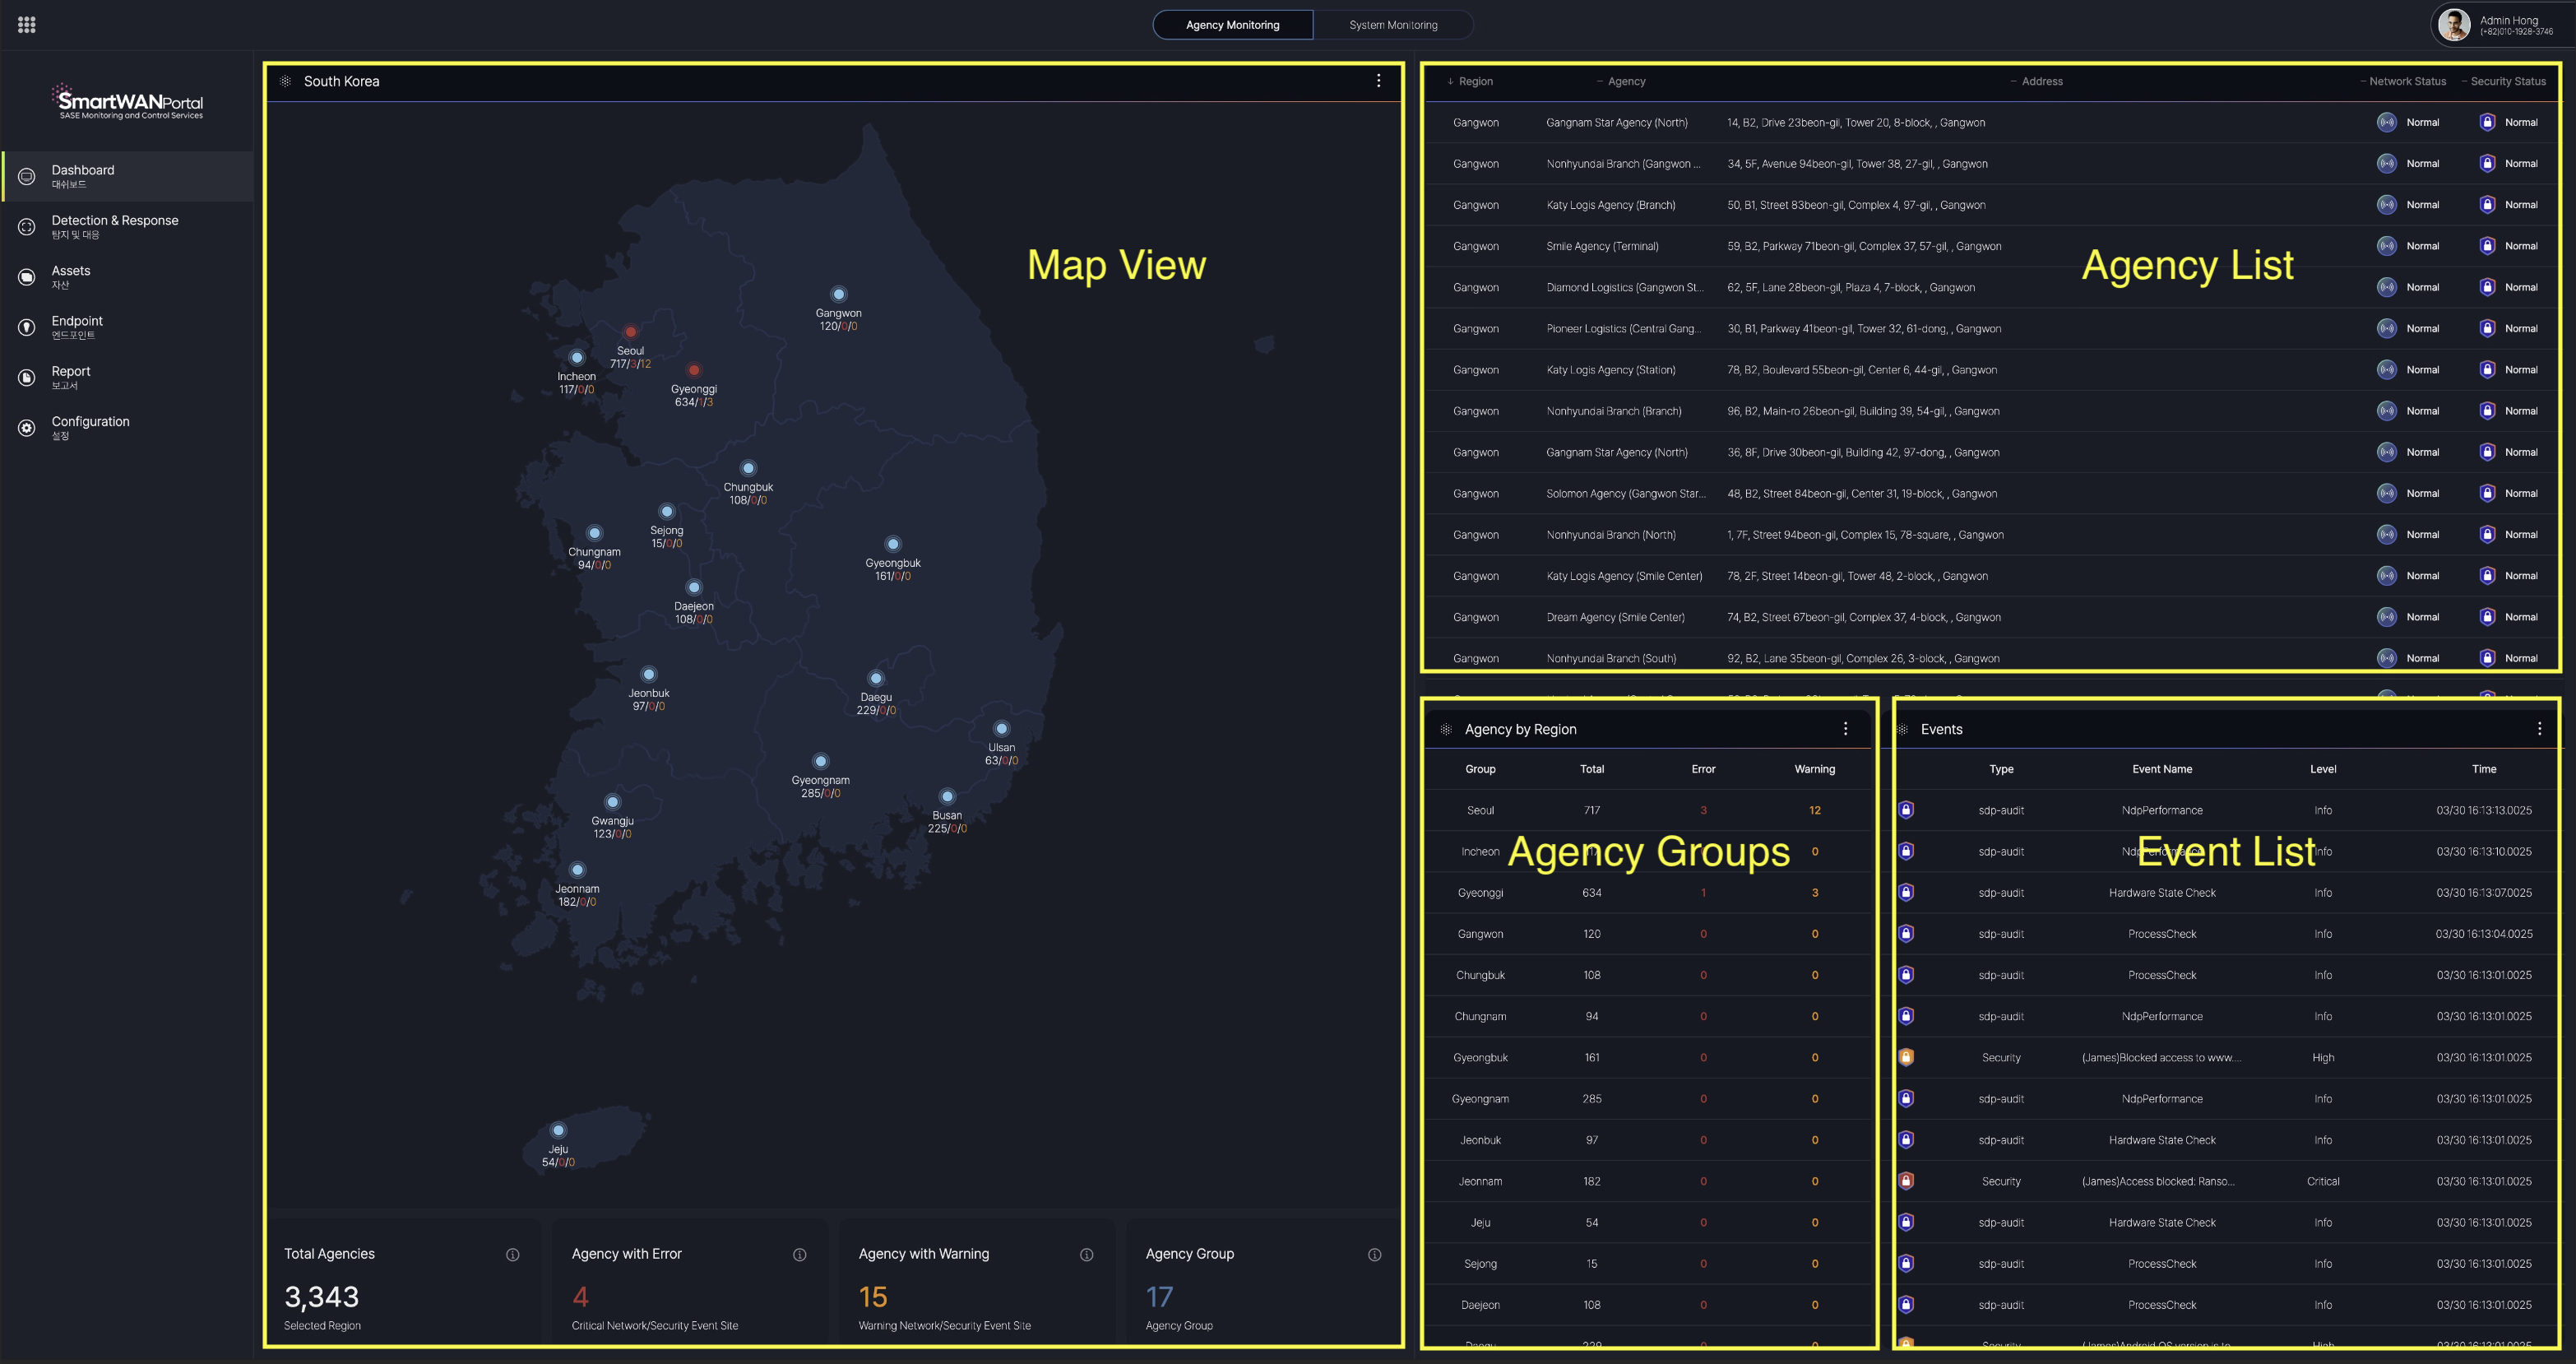
Map View
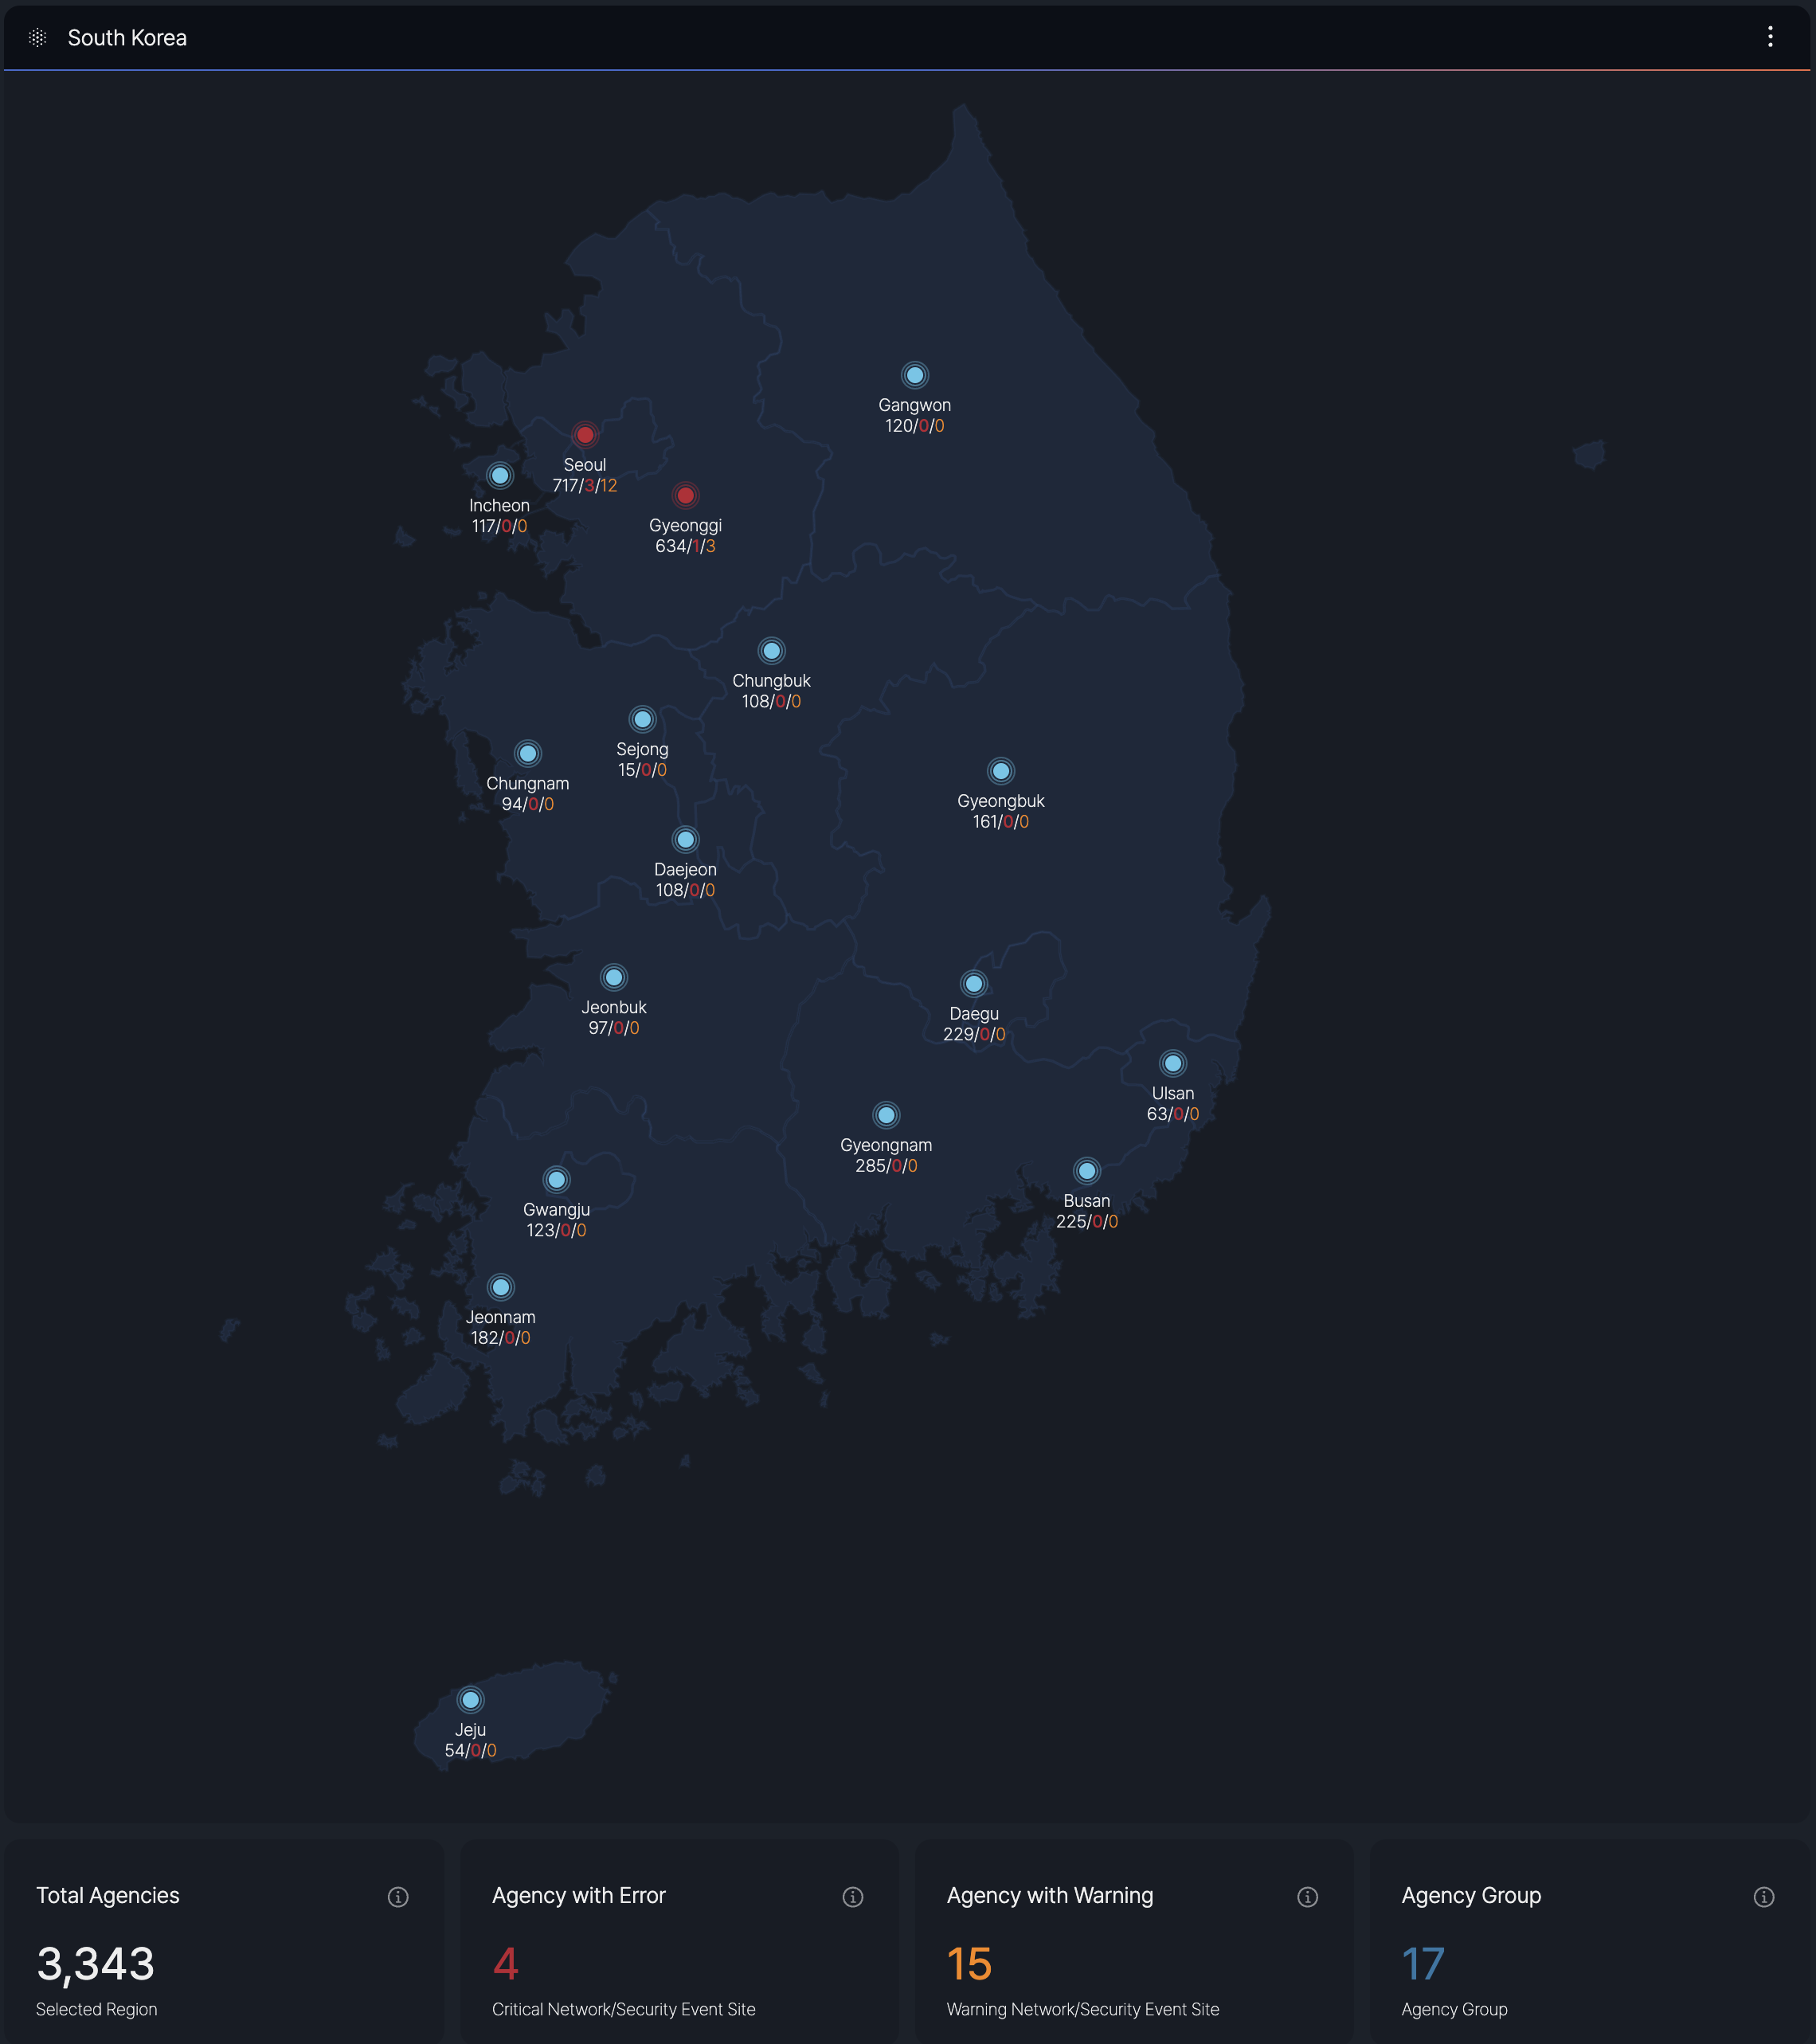
Event levels are defined by SKT's requirements.
Agency List
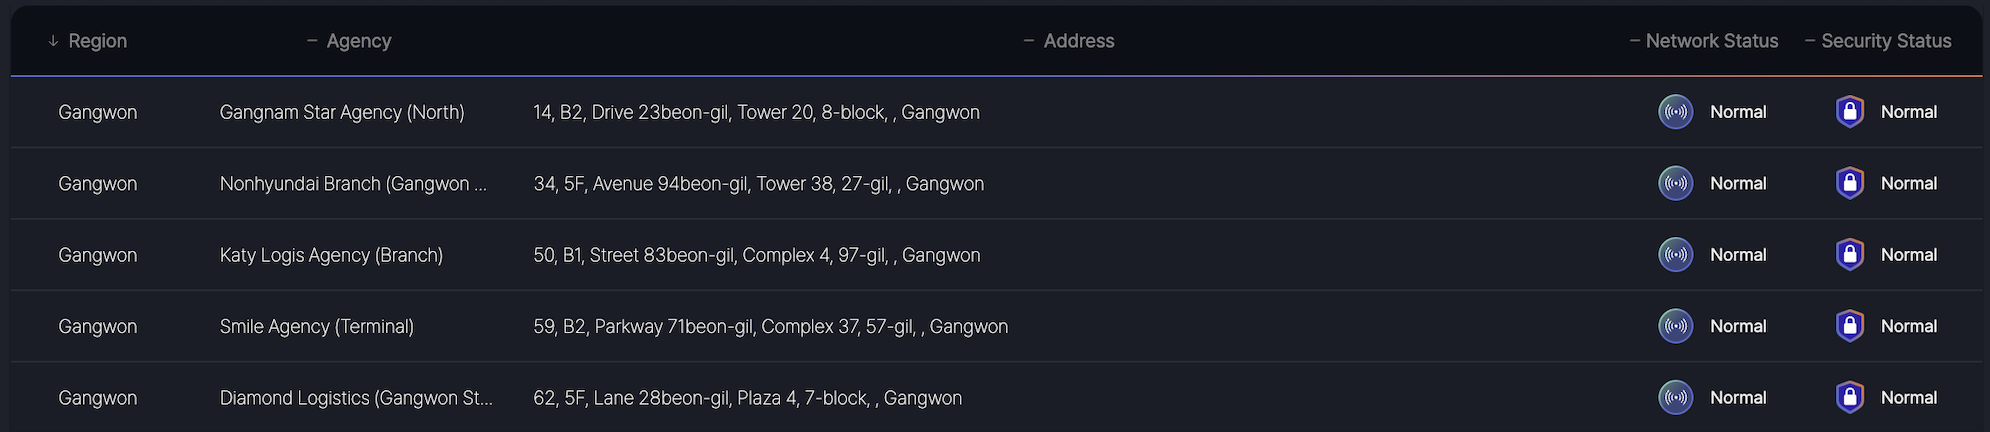
When a specific region is selected in the Map View, the dashboard displays a list of agencies registered in that region, along with detailed information on the Network Status (CPE) and Security Status (SDP) for each agency.
- Agency List: A comprehensive roster of agencies within the selected region.
- Network Status (CPE): Provides the current operational status of the Customer Premises Equipment for eacßh agency.
- Security Status (SDP): Details the security posture, including Software-Defined Perimeter (SDP) metrics, for each agency.
View details of the agency
To access an agency's detailed information:
-
Go to the Agency List in the dashboard
-
Click the desired agency name
-
The system will load the detailed agency view
Network View
This view provides a granular view of both network performance and security status for the selected agency. Users can toggle between Network View and Security View to access specific metrics.
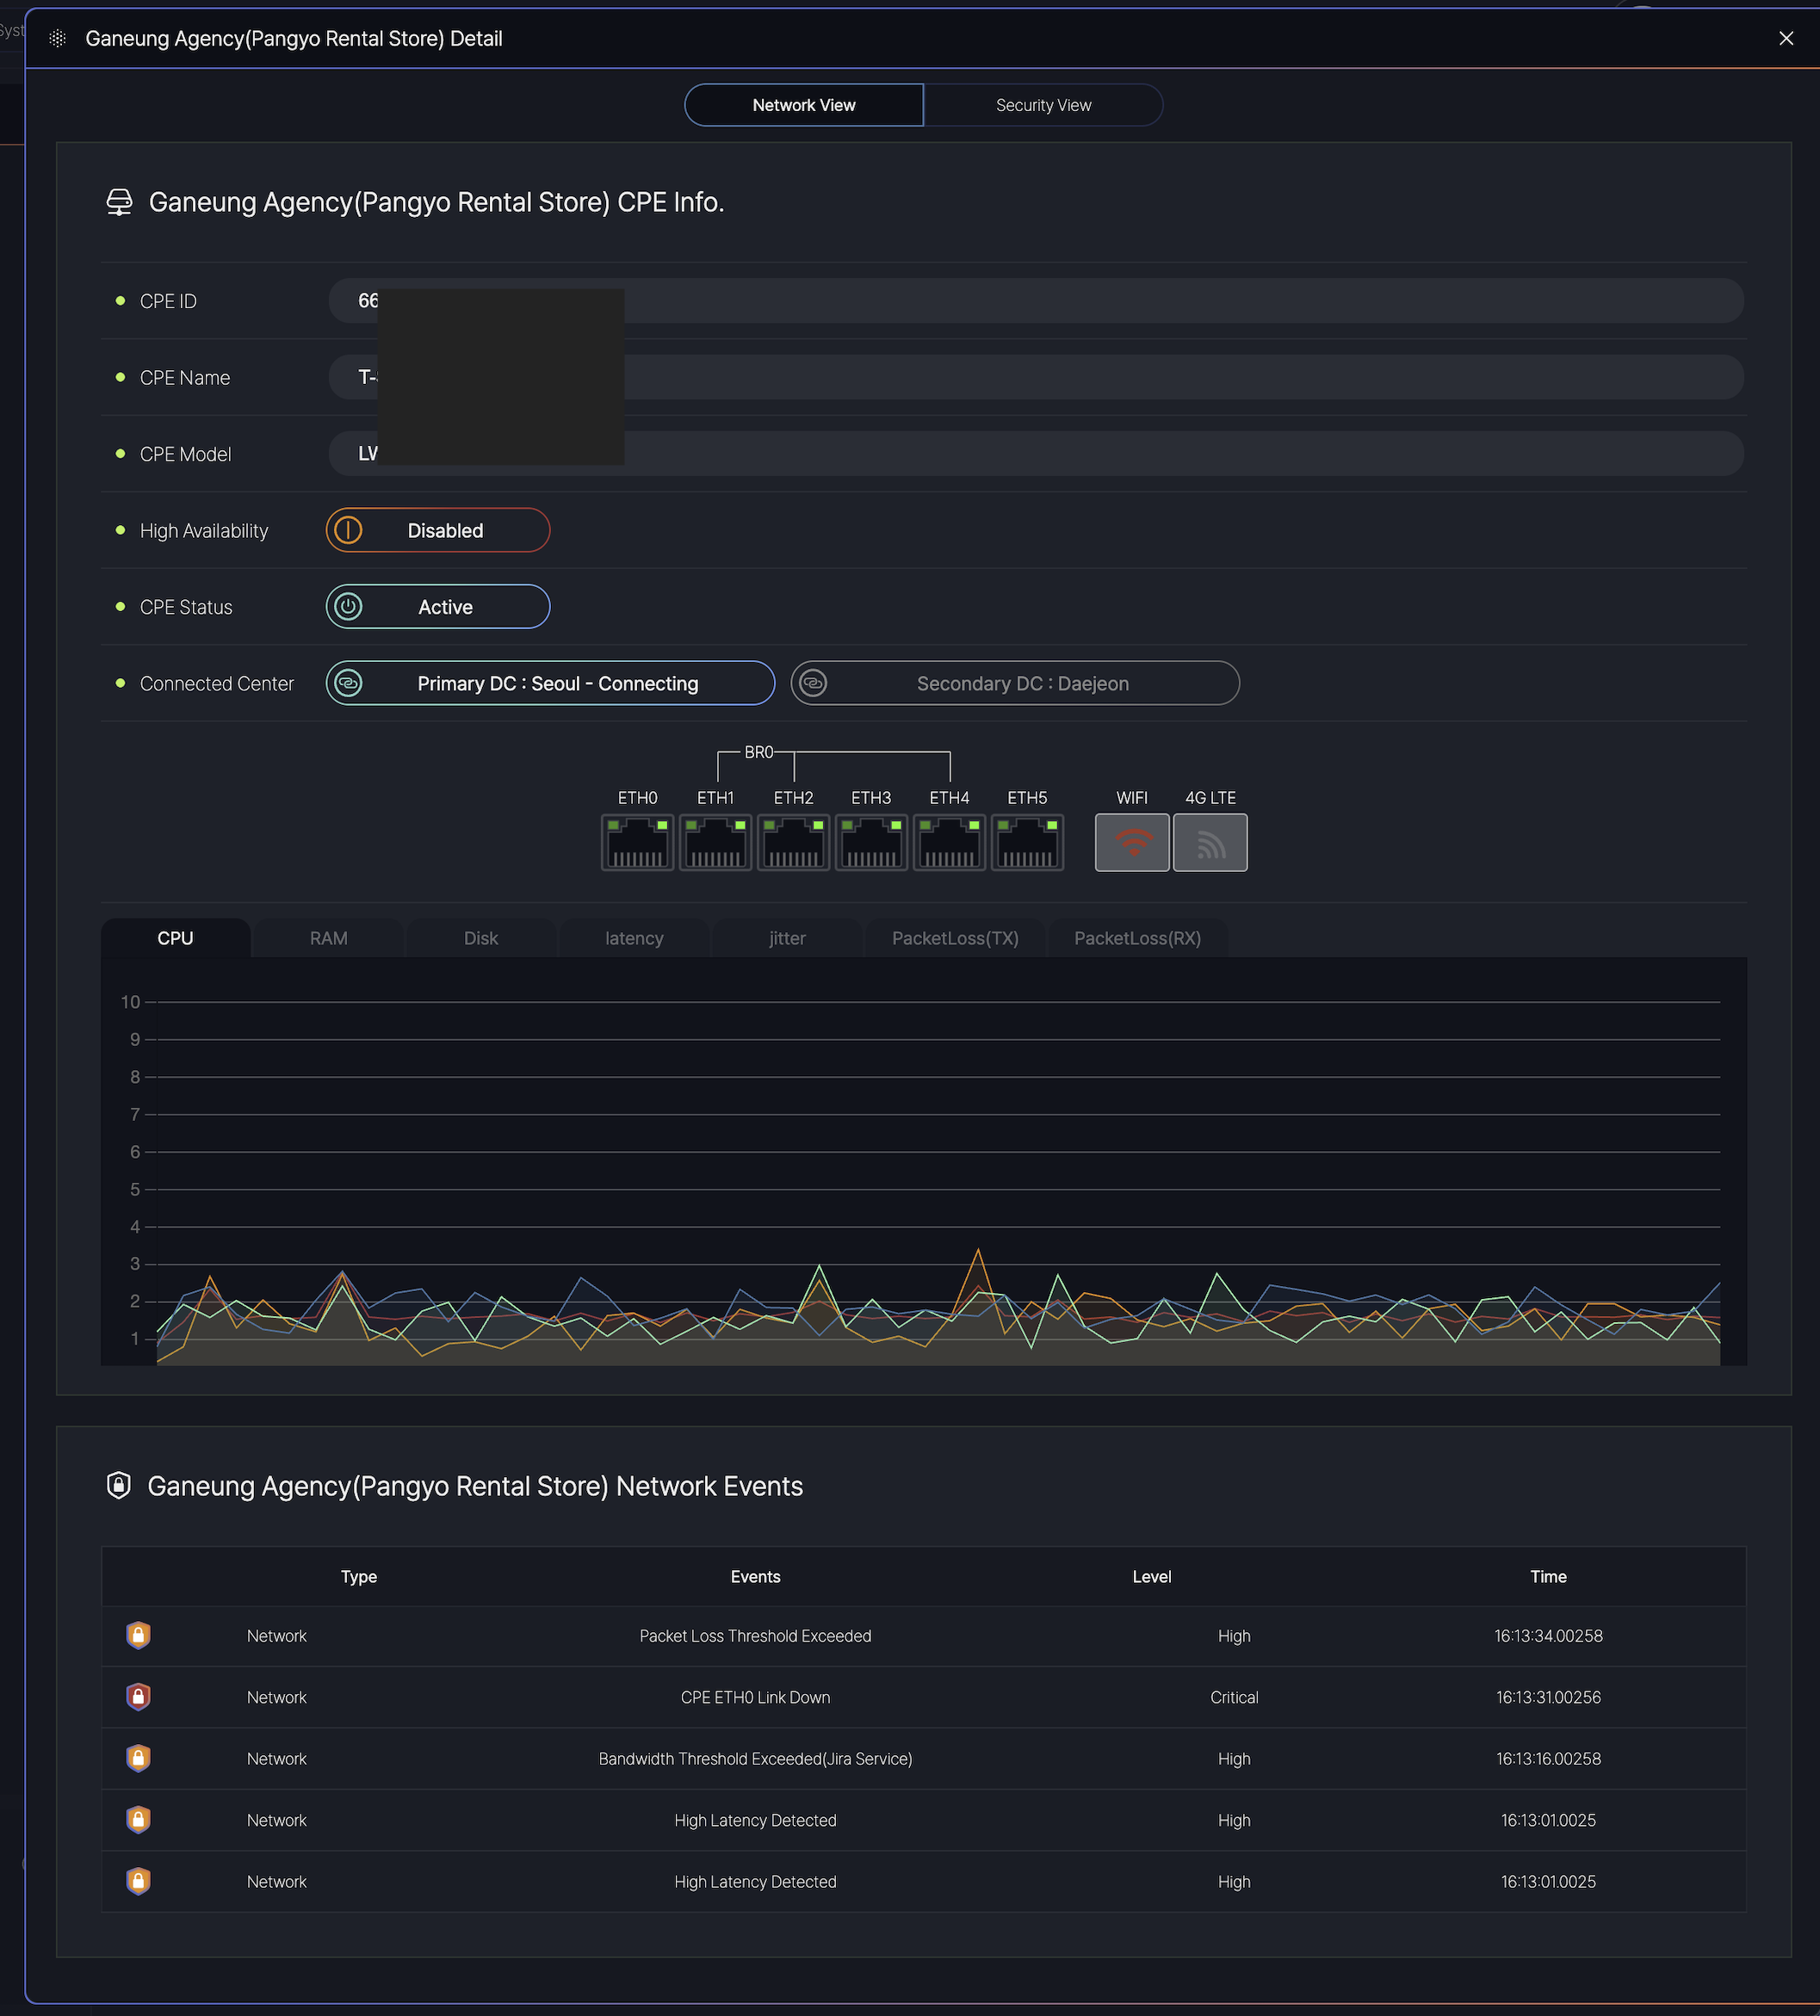
The dashboard is divided into two main tabs:
-
Network View: Displays real-time CPE status and network performance.
-
Security View: Shows security-related alerts and SDP metrics (if applicable).
Displays hardware and connectivity details:
-
CPE ID/Name/Model: Identifies the device.
-
High Availability: Indicates redundancy status ( Enabled / Disabled).
-
CPE Status:
-
Active: Normal operation.
-
Degraded: Performance issues detected.
-
Inactive: Connection lost.
-
-
Connected Data Centers: Primary (Seoul) and Secondary (Daejeon) links.
Network Performance Metrics data(Live) for troubleshooting:
-
CPU/RAM/Disk: Resource usage (% or GB).
-
Latency/Jitter: Measured in milliseconds (ms).
-
Packet Loss (TX/RX): Percentage of lost data packets.
Lists recent events with types and levels:
| Column | Description | Example |
|---|---|---|
| Type | Event category (Network/Security). | Network |
| Event | Description of the issue. | CPE ETH0 Link Down |
| Level | Severity: Info, High, Critical. |
Critical |
| Time | Timestamp (HH:MM:SS.milliseconds). | 16:13:31.00256 |
Security View
This view provides comprehensive monitoring and management capabilities for the selected agency, displaying real-time network status, user information, security events, and service connectivity. The interface is divided into multiple sections for efficient administration.
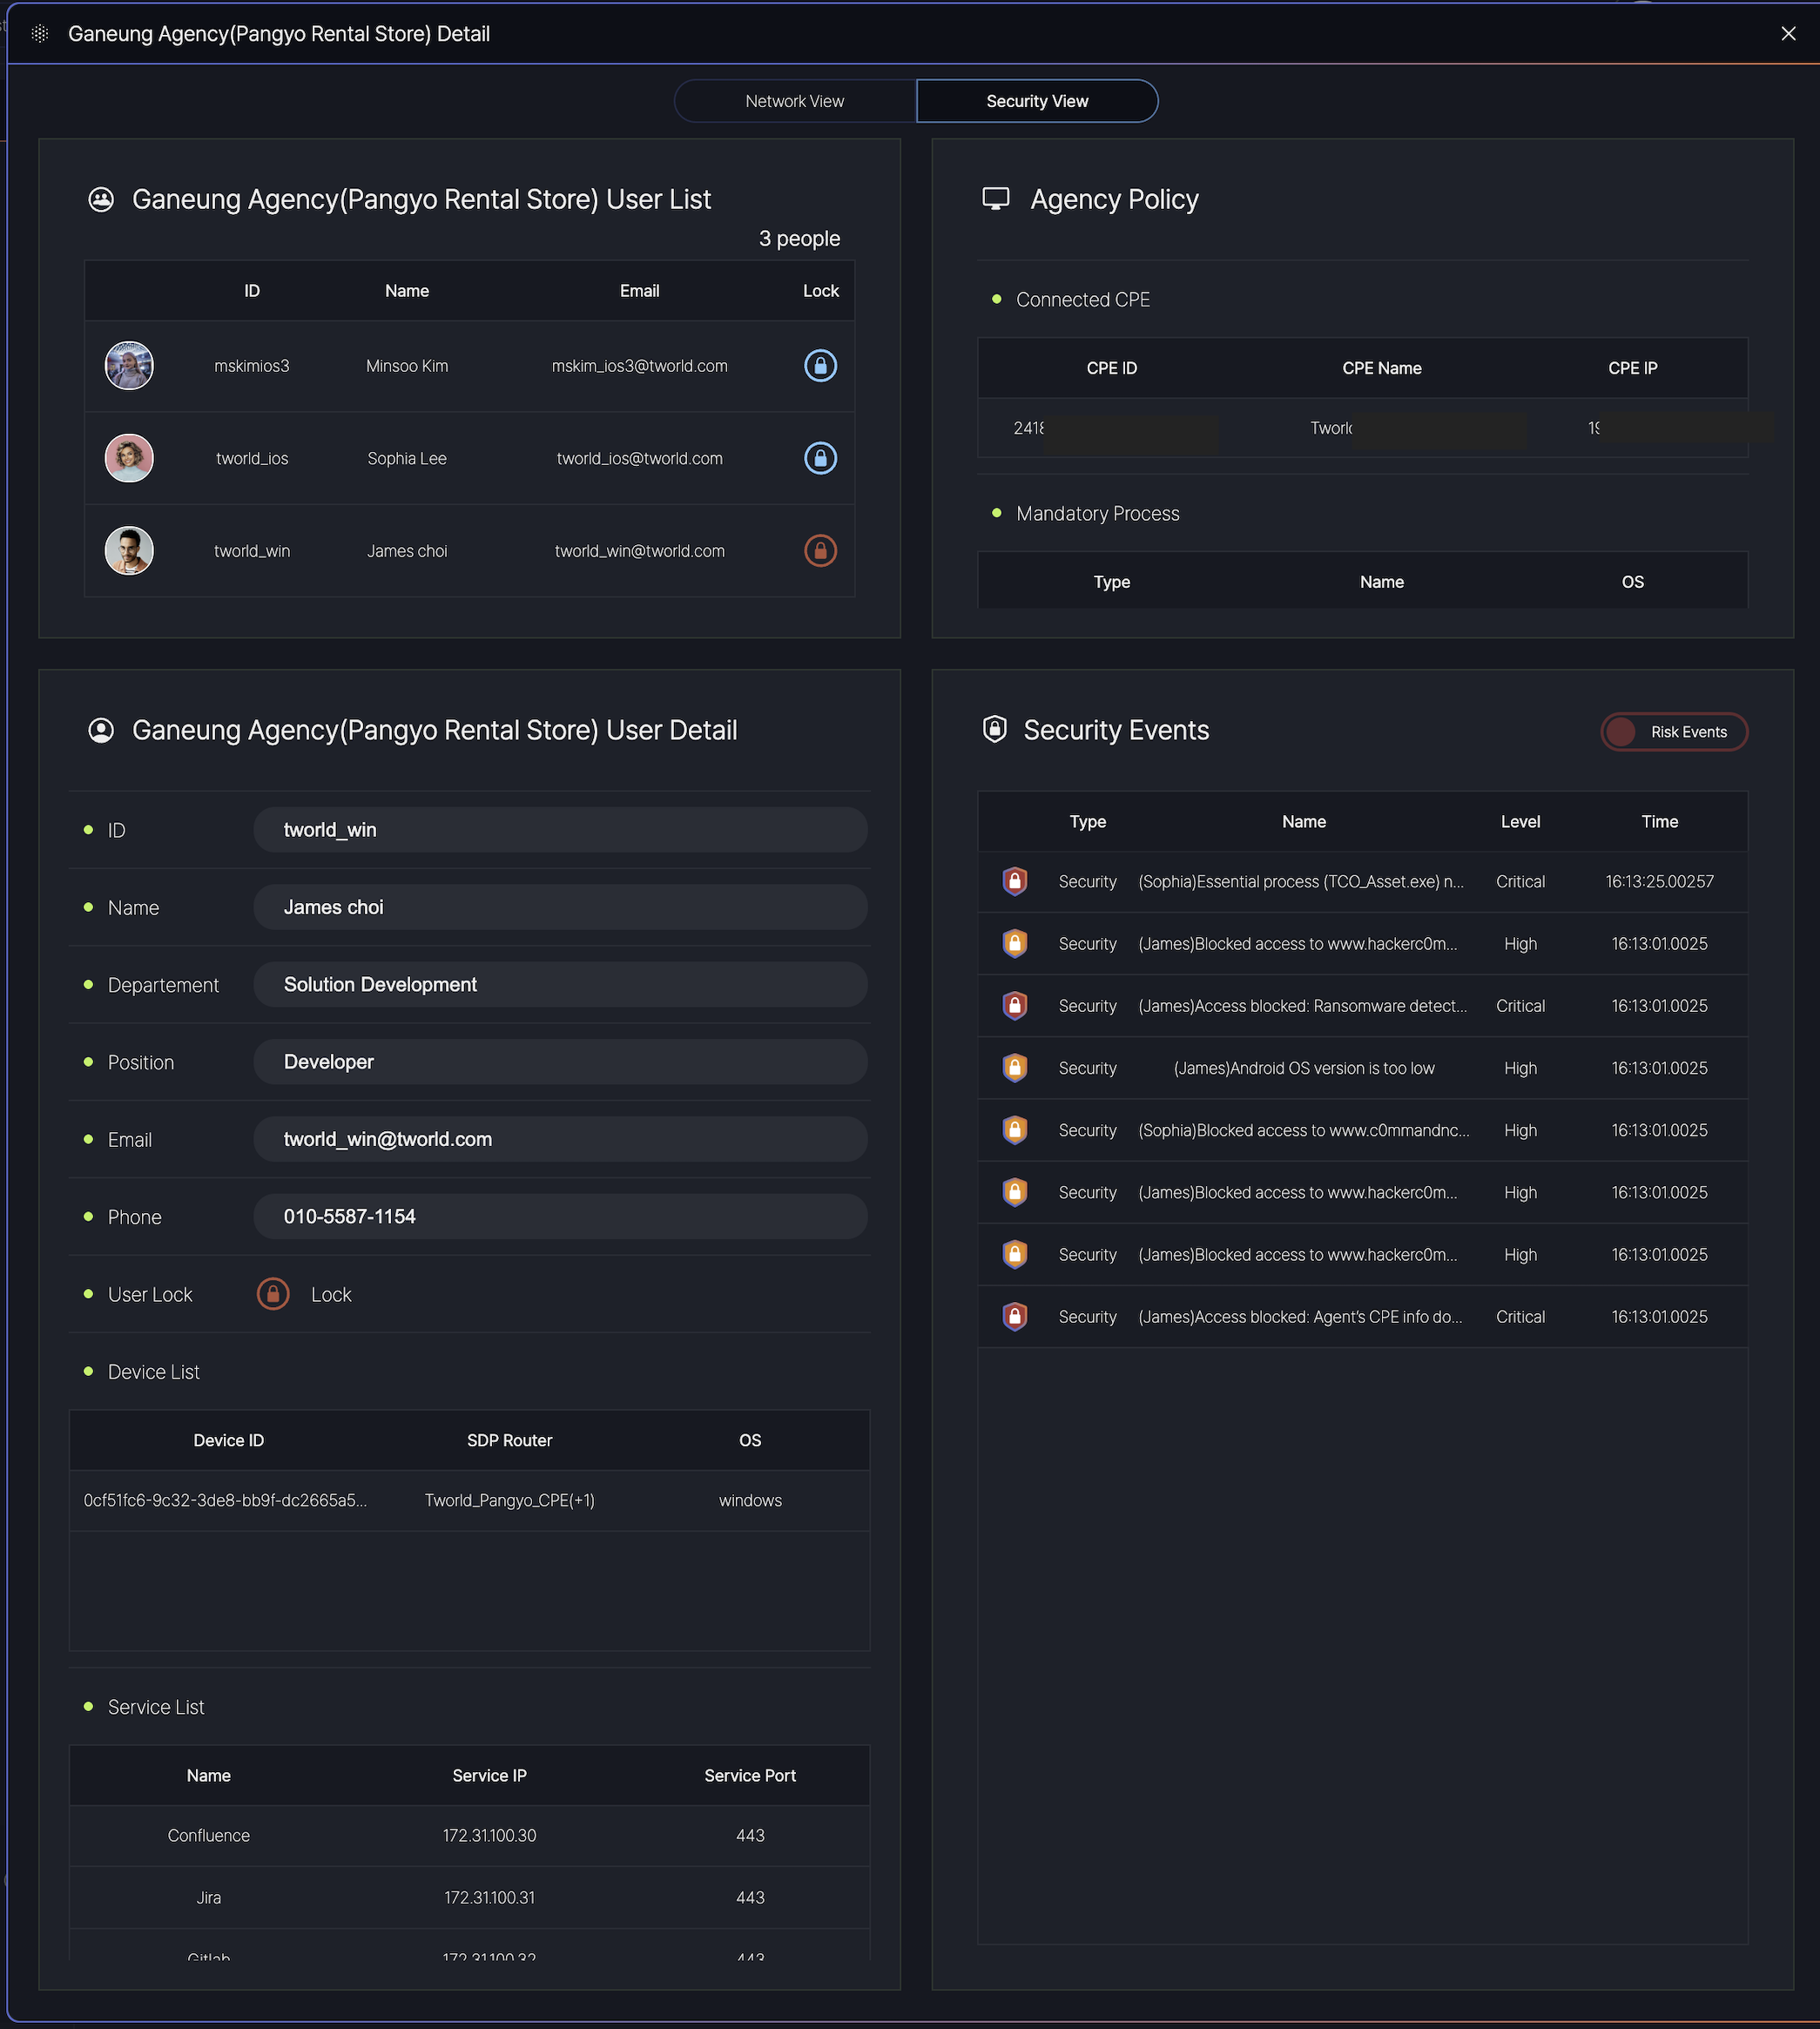
User Management Section
- User List
-
Displays all registered users (currently 3 users) with:
-
ID: Unique user identifier (e.g.,
mskimos3) -
Name: Full name of the user (e.g.,
Minsco.ftm) -
Email: Associated email address (e.g.,
mskim.ios8@tworld.com) -
Lock Status: 💬 indicates an active session (no lock applied).
-
-
- User Detail
-
Expands on selected user profiles with:
-
Department/Role: Organizational hierarchy (e.g.,
Solution Development > Developer). -
Contact: Email (
tworld_win@tworld.com) and phone (010-5587-1154). -
Device List: Managed devices linked to the user (e.g.,
SDP Routerwith OS details).
-
-
Agency Policy & Configuration
- Connected CPE
-
Hardware details of the Customer Premises Equipment:
-
CPE ID/IP: Unique identifiers for the network device.
-
CPE Name: Label for easy recognition.
-
-
- Mandatory Processes
-
Critical processes are monitored by type, name, and operating system.
-
Security Monitoring
- Security Events Table
-
Lists real-time security incidents with:
-
Type/Name: Event description (e.g.,
Blocked access to ransomware sites). -
Level: Severity (
Critical,High). -
Time: Precise timestamp (e.g.,
16:13:01.0025).
-
-
- Example Events:
-
Critical: Ransomware detection, essential process violations. -
High: Blocked access to malicious domains, outdated OS alerts.
-
Agency Groups
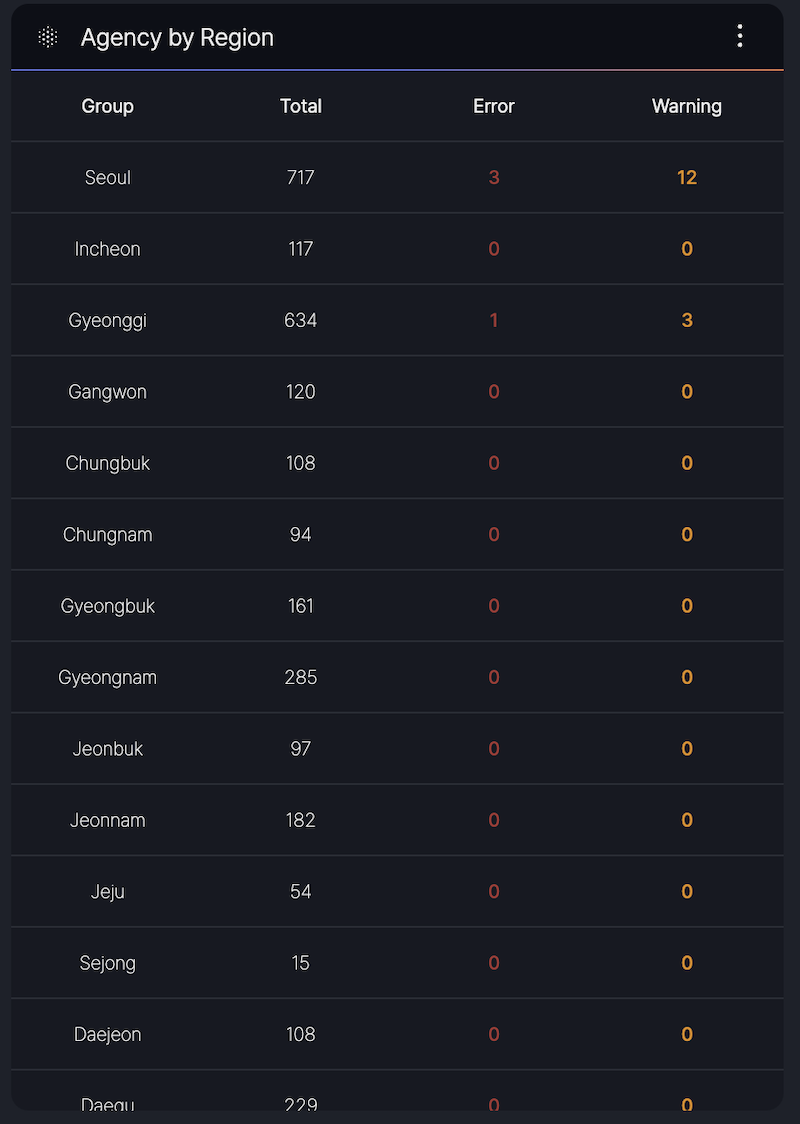
The Agency Group section provides a summary of agency counts per region and detailed status information for CPE.
- Region-Based Counts: Displays the total number of agencies in each region.
- CPE Status Info: Offers insights into the operational status of CPE devices across the agencies
Event List
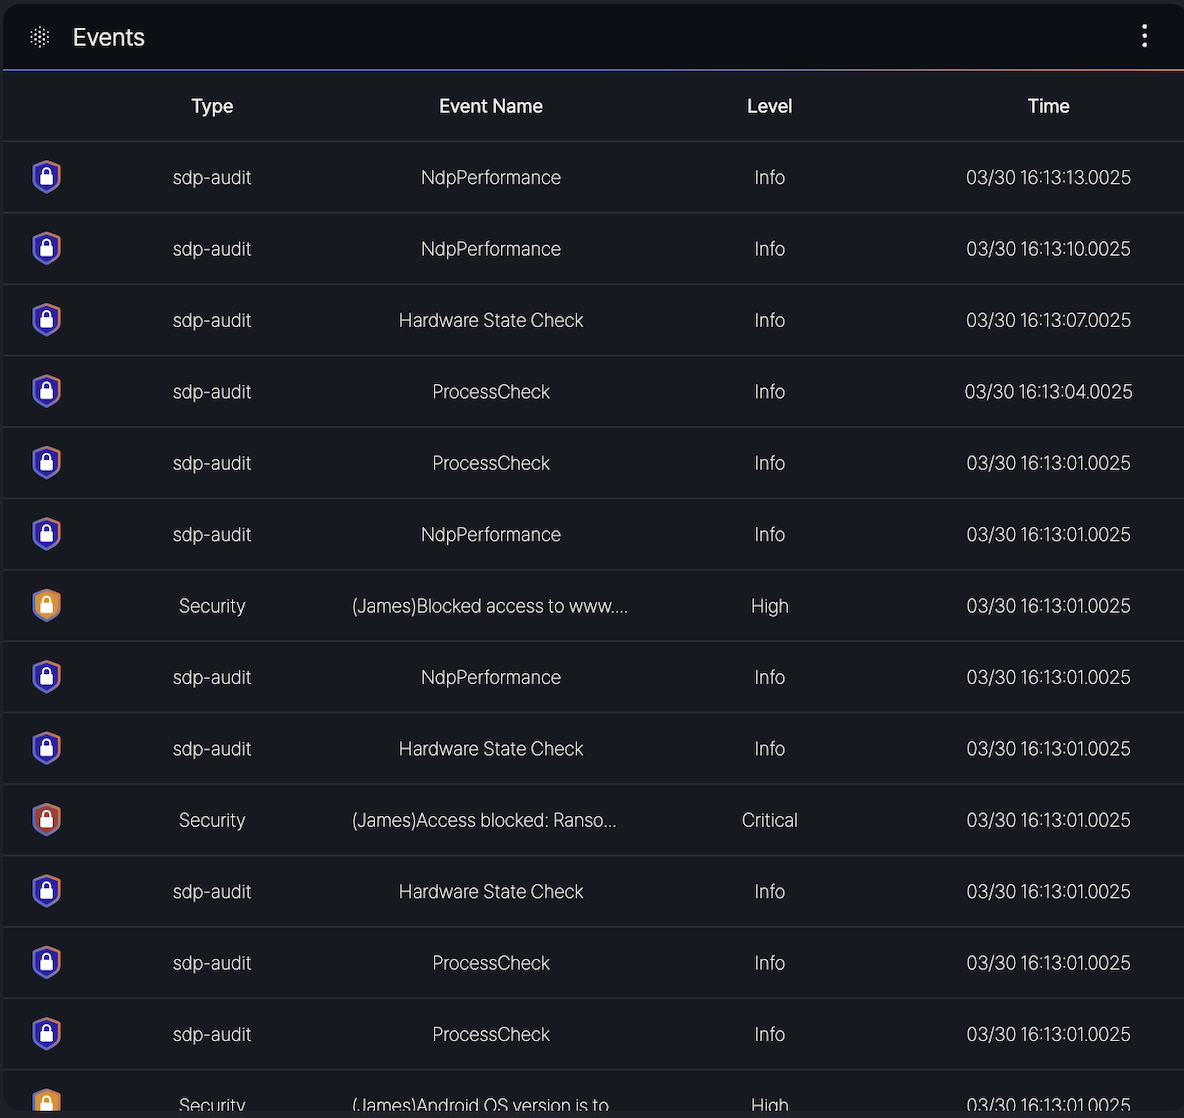
- Type: Indicates the category of the event (e.g., sdp-audit, Security).
- Event Name: Specifies the event description (e.g., NdpPerformance, Hardware State Check, ProcessCheck, or security-related messages like [JAMES] Blocked access to www…).
- Level: Denotes the severity of the event, categorized as Info, Minor, or Critical, Block.
- Time: Shows the timestamp of the event in the format MM/DD HH:MM:SS.milliseconds (e.g., 03/30 16:13:00.025).
- sdp-audit events such as NdpPerformance and Hardware State Check with Info level.
- Security events like [JAMES] Access blocked: Rans… with Critical level or [JAMES] Android OS version is to… with High level.
System monitoring
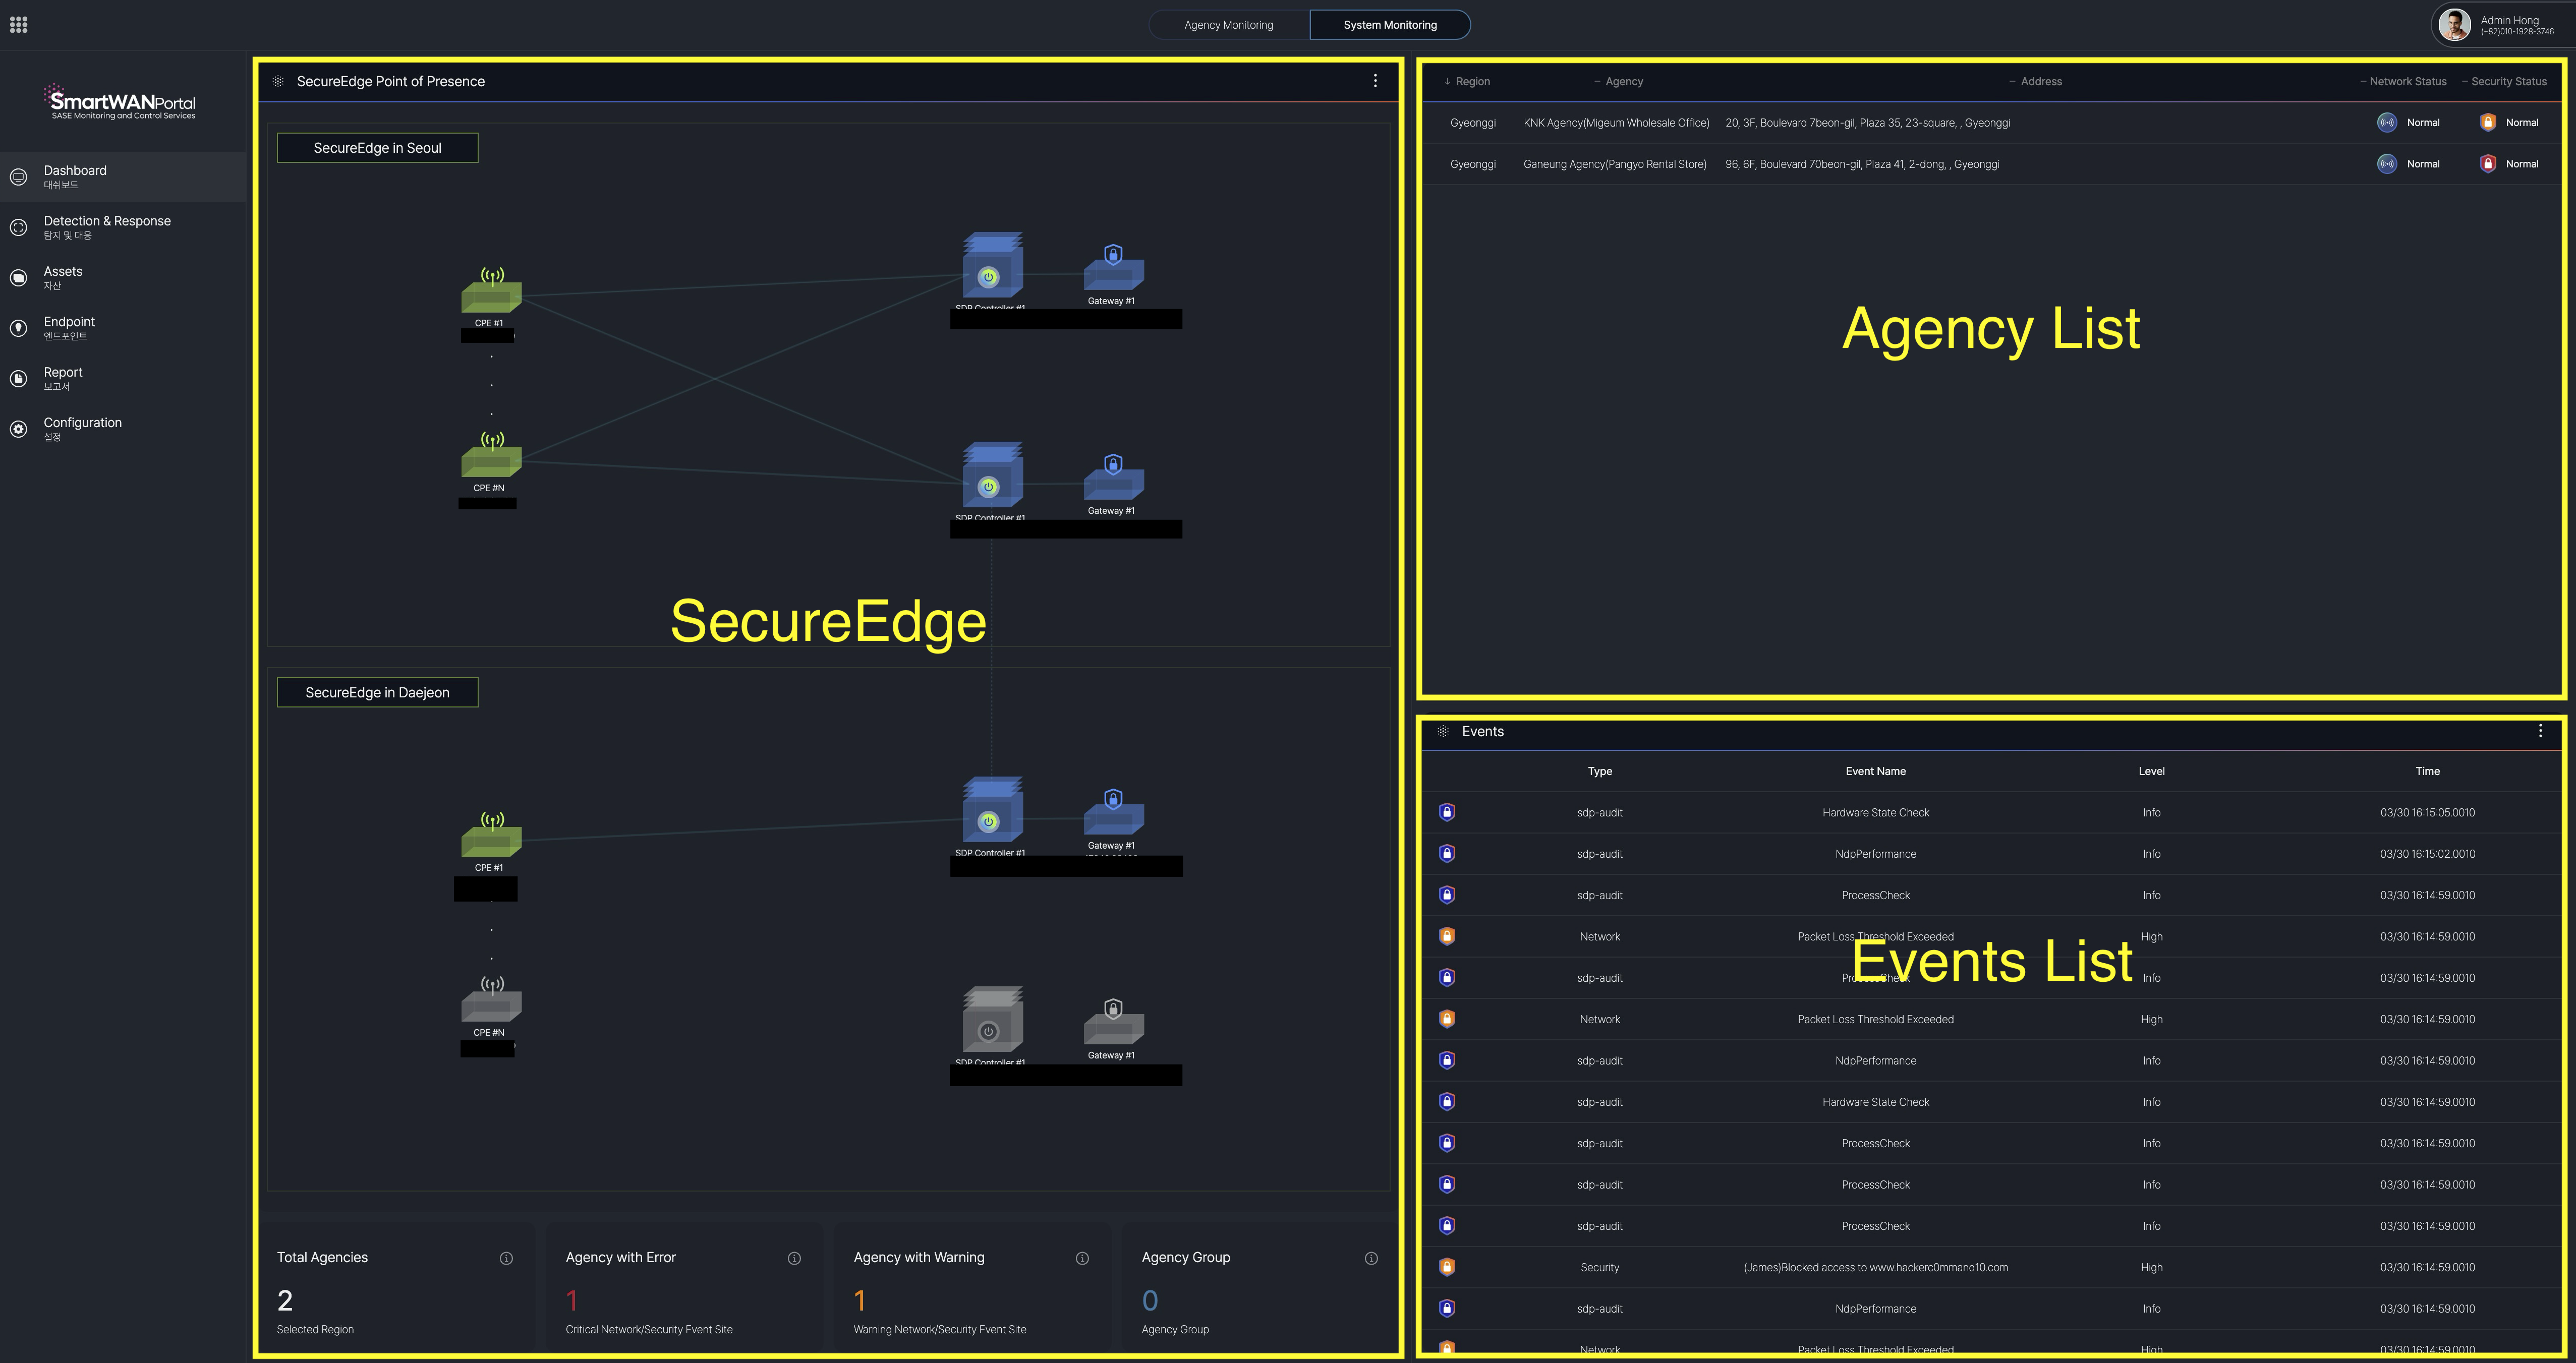
SecureEdge point of presence
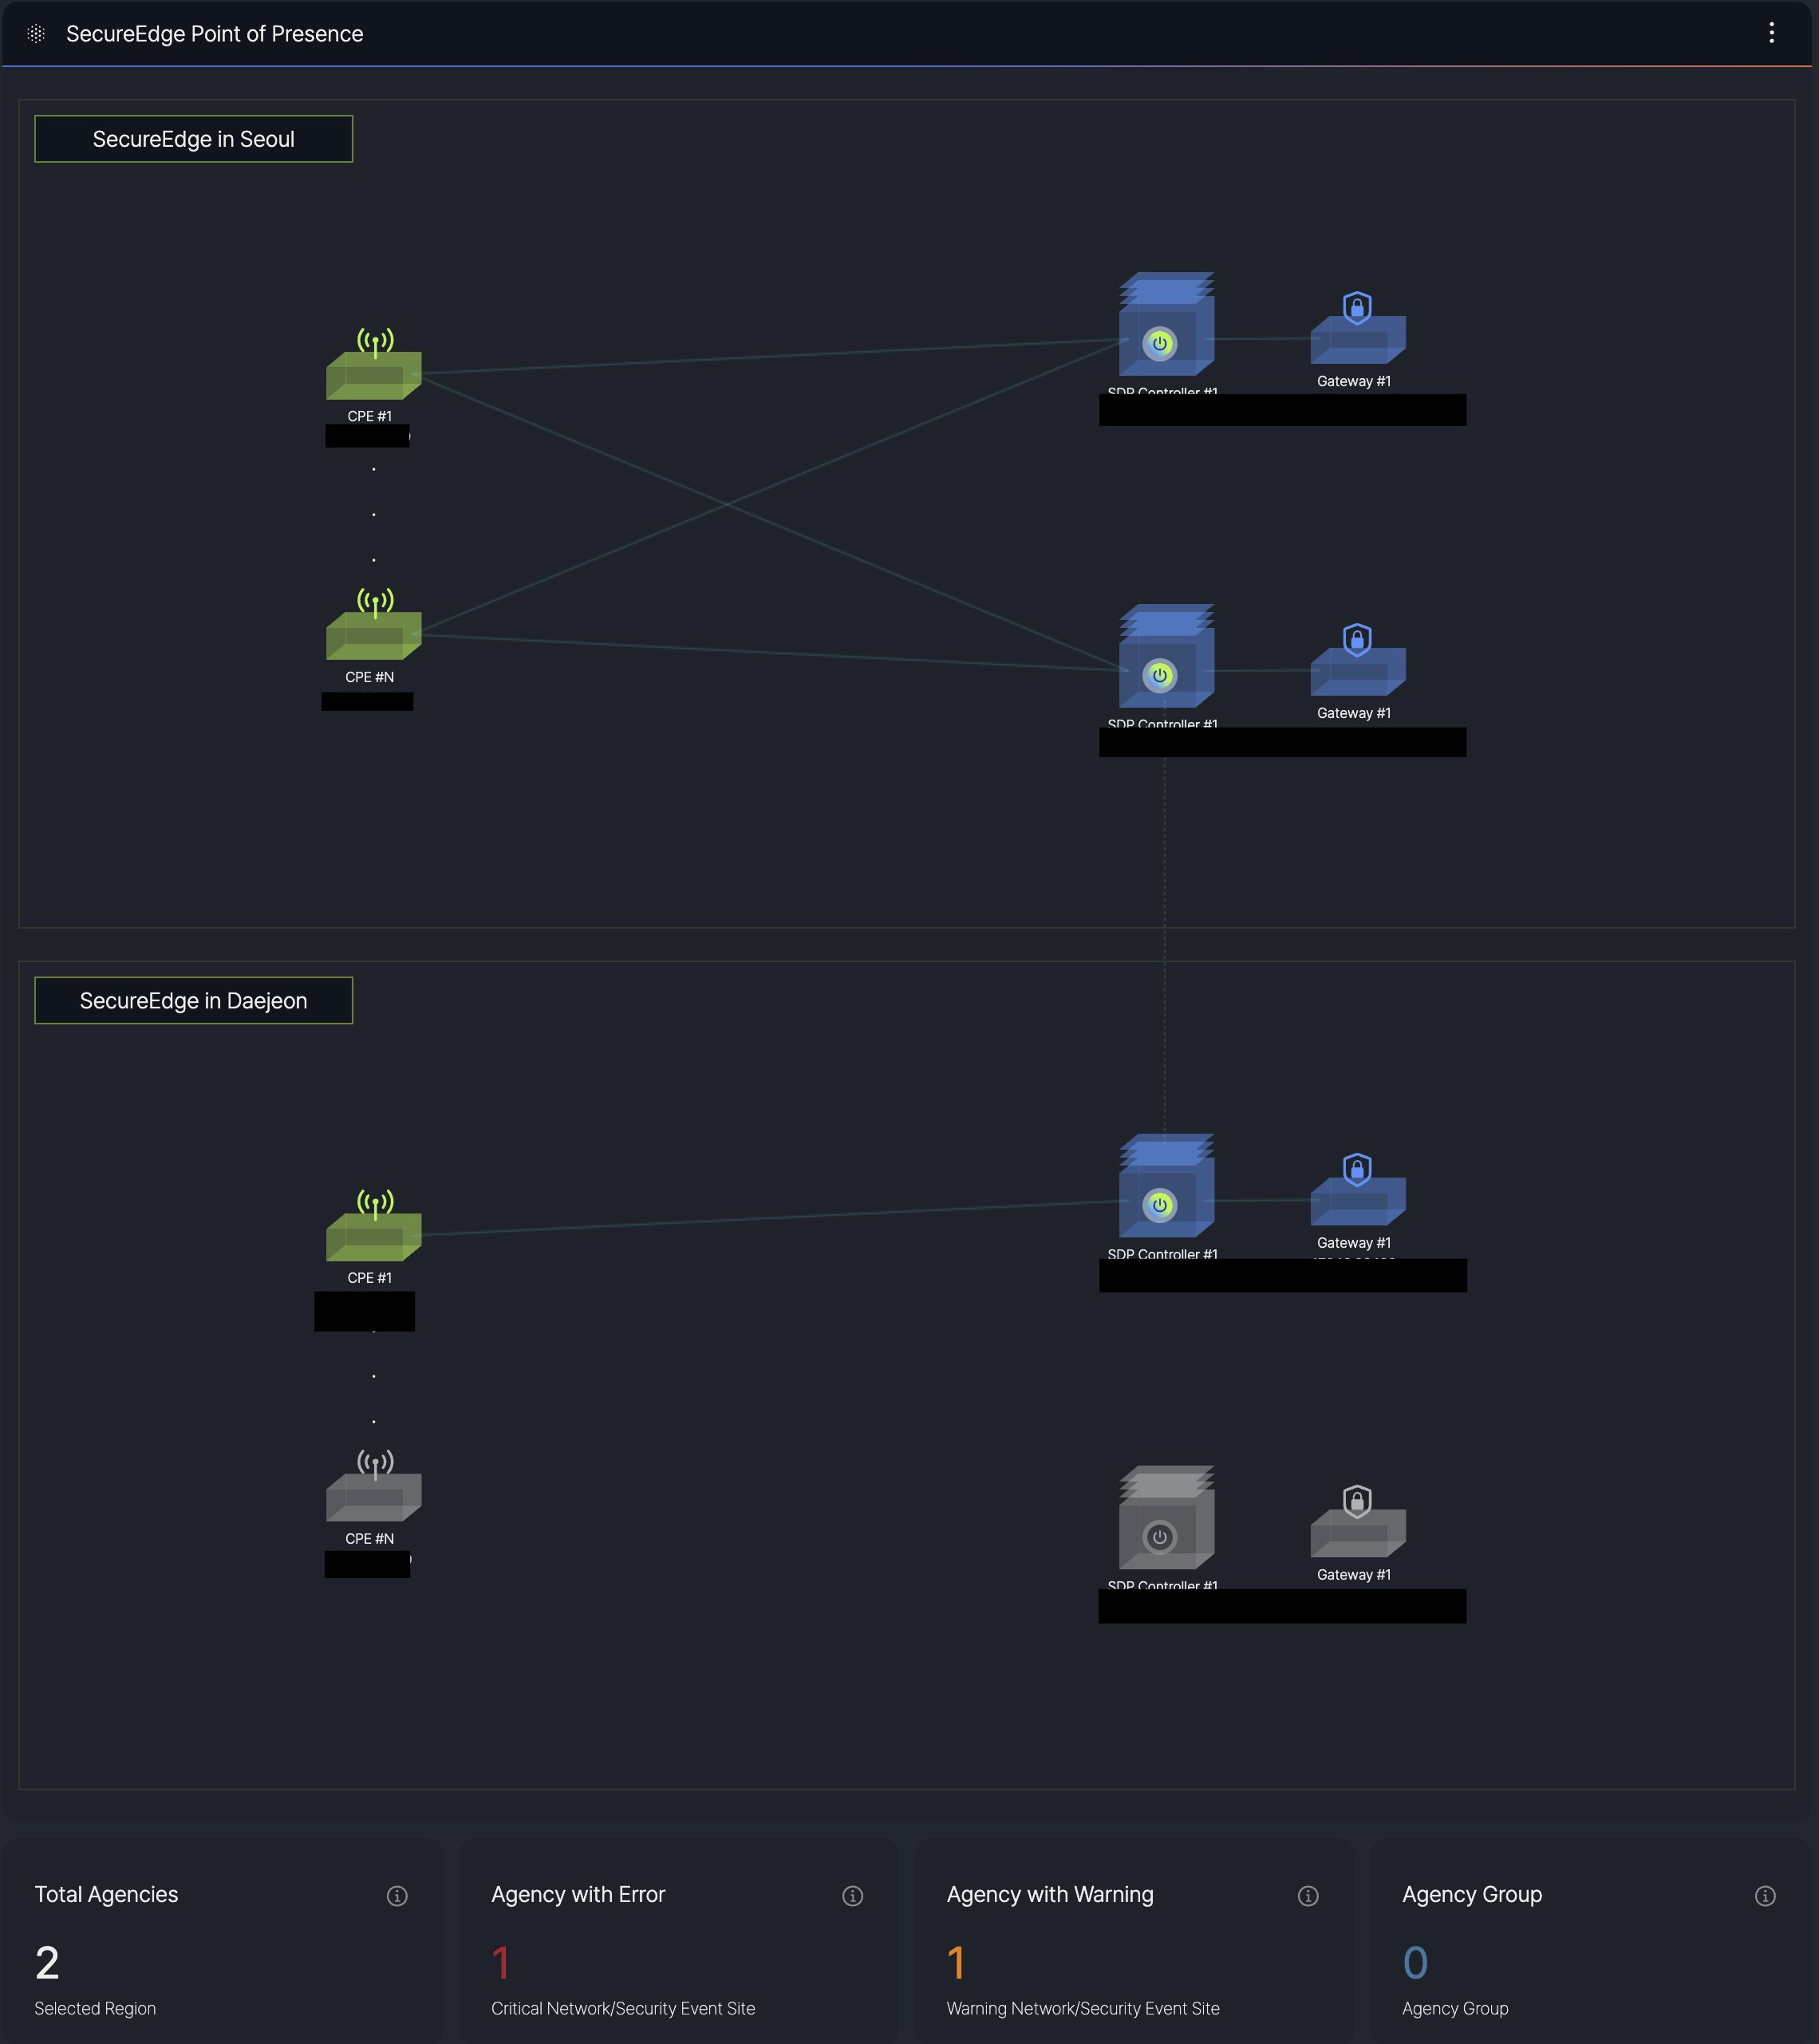
It shows SecureEdge's distributed architecture. The visual indicators show system statuses, and on the bottom, highlight critical/security events of the agency.
This monitoring supports SKT's internal operations only, providing real-time monitoring of their SecureEdge deployment through redundant controllers and gateways at each location.
Agency List
It's the same as the agency list in Agency Monitoring.
Events List
It's the same as the events list in Agency Monitoring.
Risk Scoring (under development)
This dashboard provides a consolidated view of network security compliance, threat protection status, and regulatory adherence for monitoring and reporting purposes.

The current visualization serves as a prototype. We will develop optimized data representation formats aligned with operational objectives during the implementation phase.