Dashboard
Overview
The OpenSASE Dashboard provides a centralized, real-time interface for comprehensive security monitoring and management across hybrid IT environments.
Designed to integrate on-premises and cloud-based security data, the dashboard offers a unified view of an organization’s security posture, enabling proactive threat detection, alert management, and streamlined compliance tracking.
Getting Started
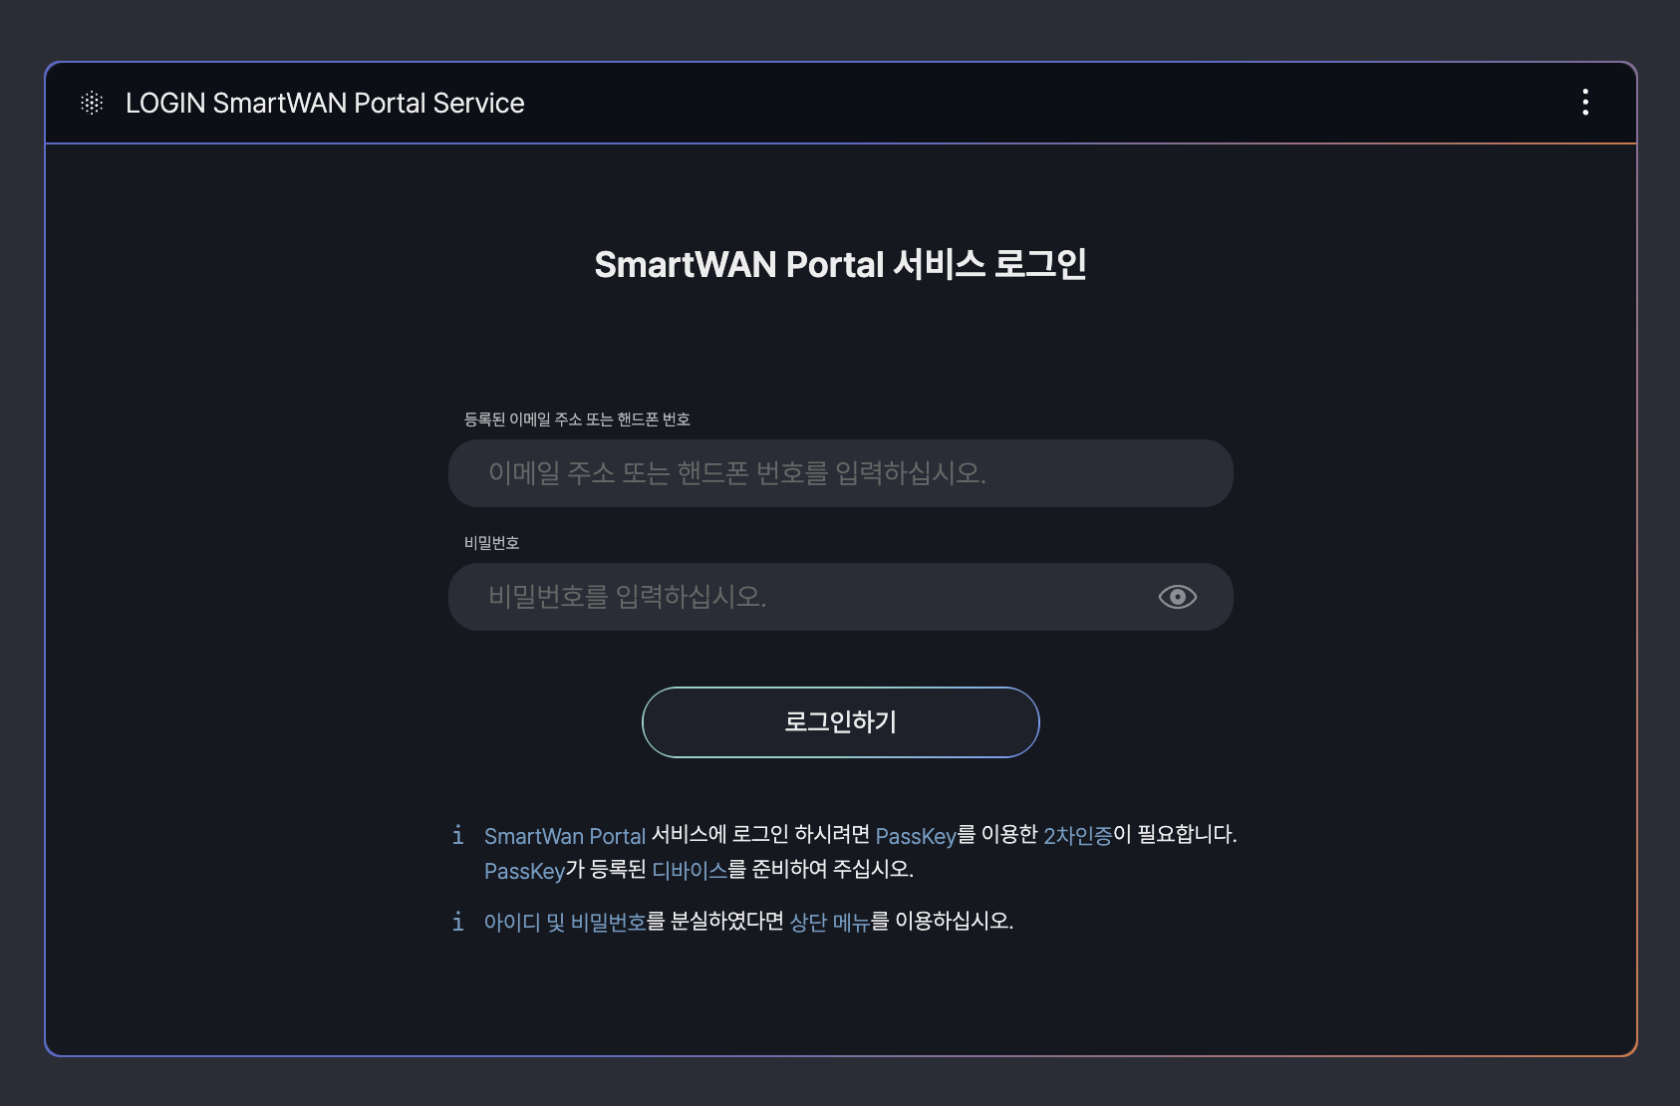
접속Logging 가능한In 사용자with 계정으로an 로그인Accessible User Account
To begin, log in using a user account with access privileges.
가이드는This SKT의guide is based on SKT’s SmartWAN Portal. Updates will be continuously applied to reflect future changes.
Pre-Configured Dashboards
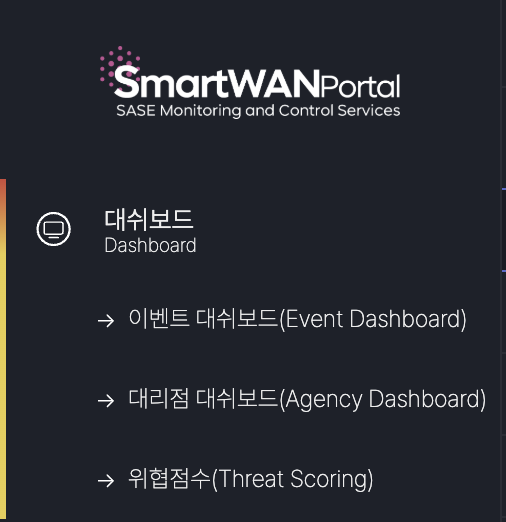
The system currently offers three pre-configured dashboard types for users.
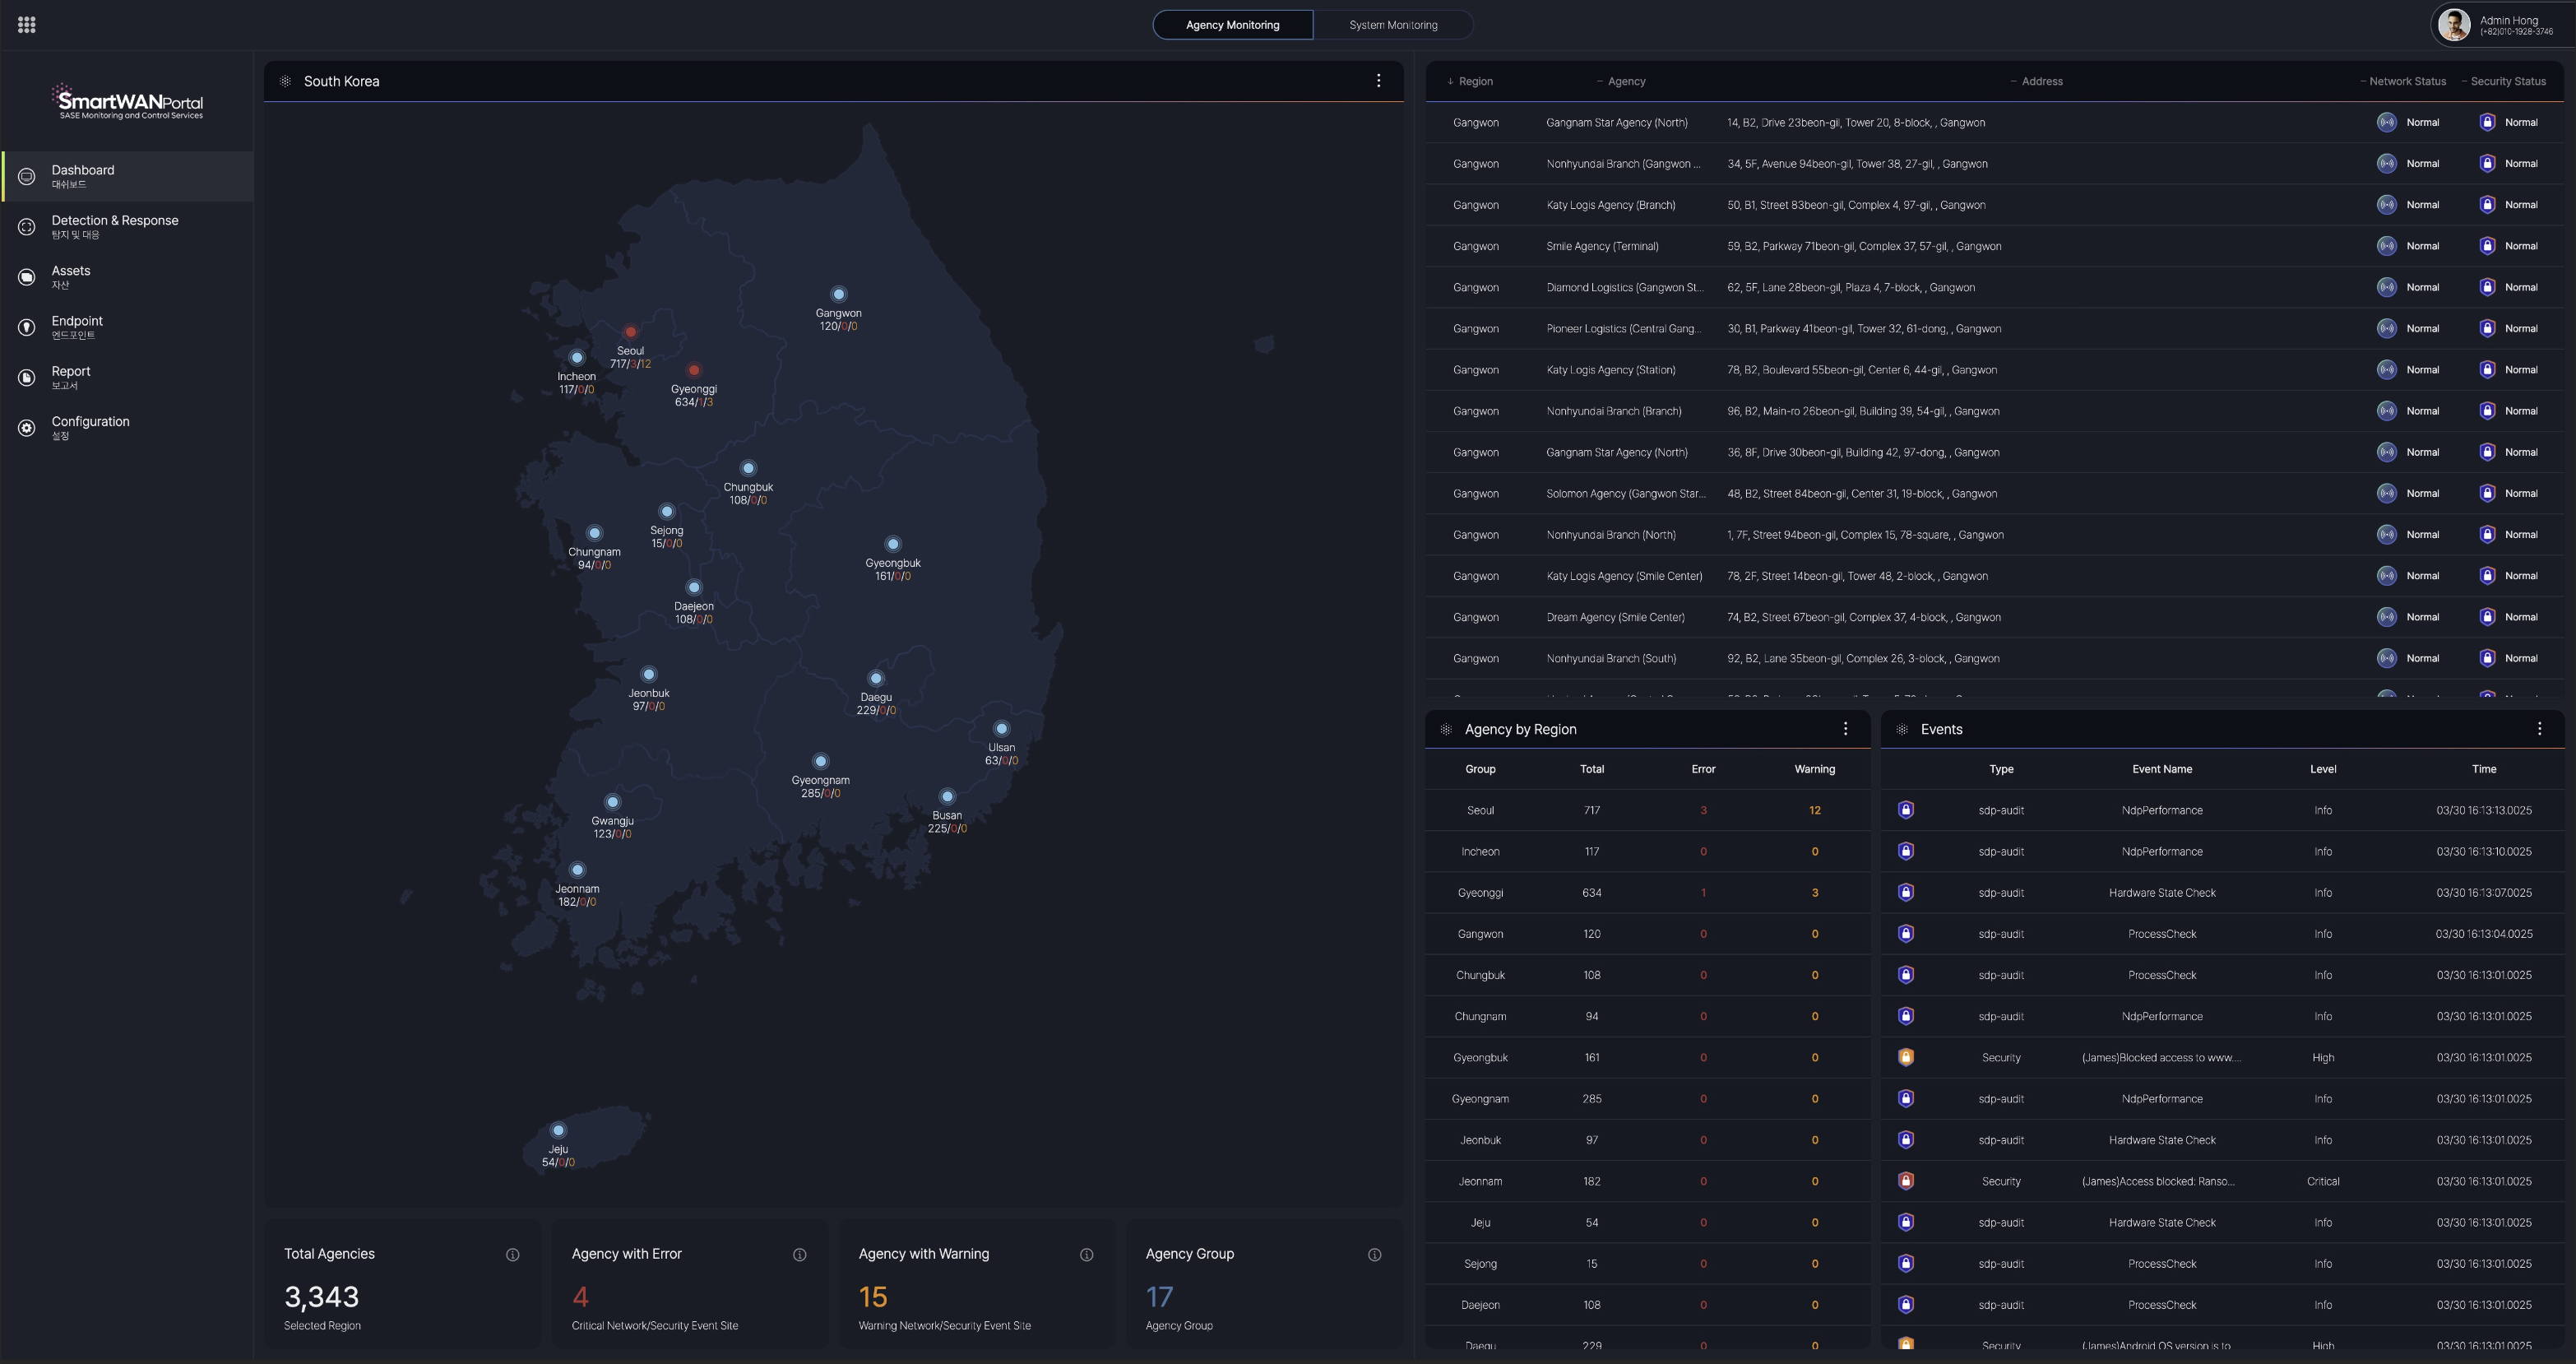
The visualization of data provided by the SmartWAN Portal 을is 기반으로categorized 제공합니다into three distinct types. Upon accessing the SmartWAN Portal, the default landing page is fixed to the Agency Dashboard.
Pre-defined Dashboards
현재 총 3가지 유형의 대시보드가 미리 구성되어 있다.
Currently, the dashboards are configured for the monitoring purposes of SKT’s agency SmartWAN system.
1. Event Dashboard (under development)
SmartWAN이벤트 Potal대시보드는 에서다양한 Datasource로 부터 수집되어 제공하는된 데이터의Incidents, 시각화Alerts, 처Treats 등에 대한 집계 정보 및 상태 관리 영역은 총 3가지 유형으로현황 정의되어보를 있으며 SmartWAN Potal 접속 시 나타나는 첫 화면은 Agency Dashboard 로 고정되어 있제공한다.
현재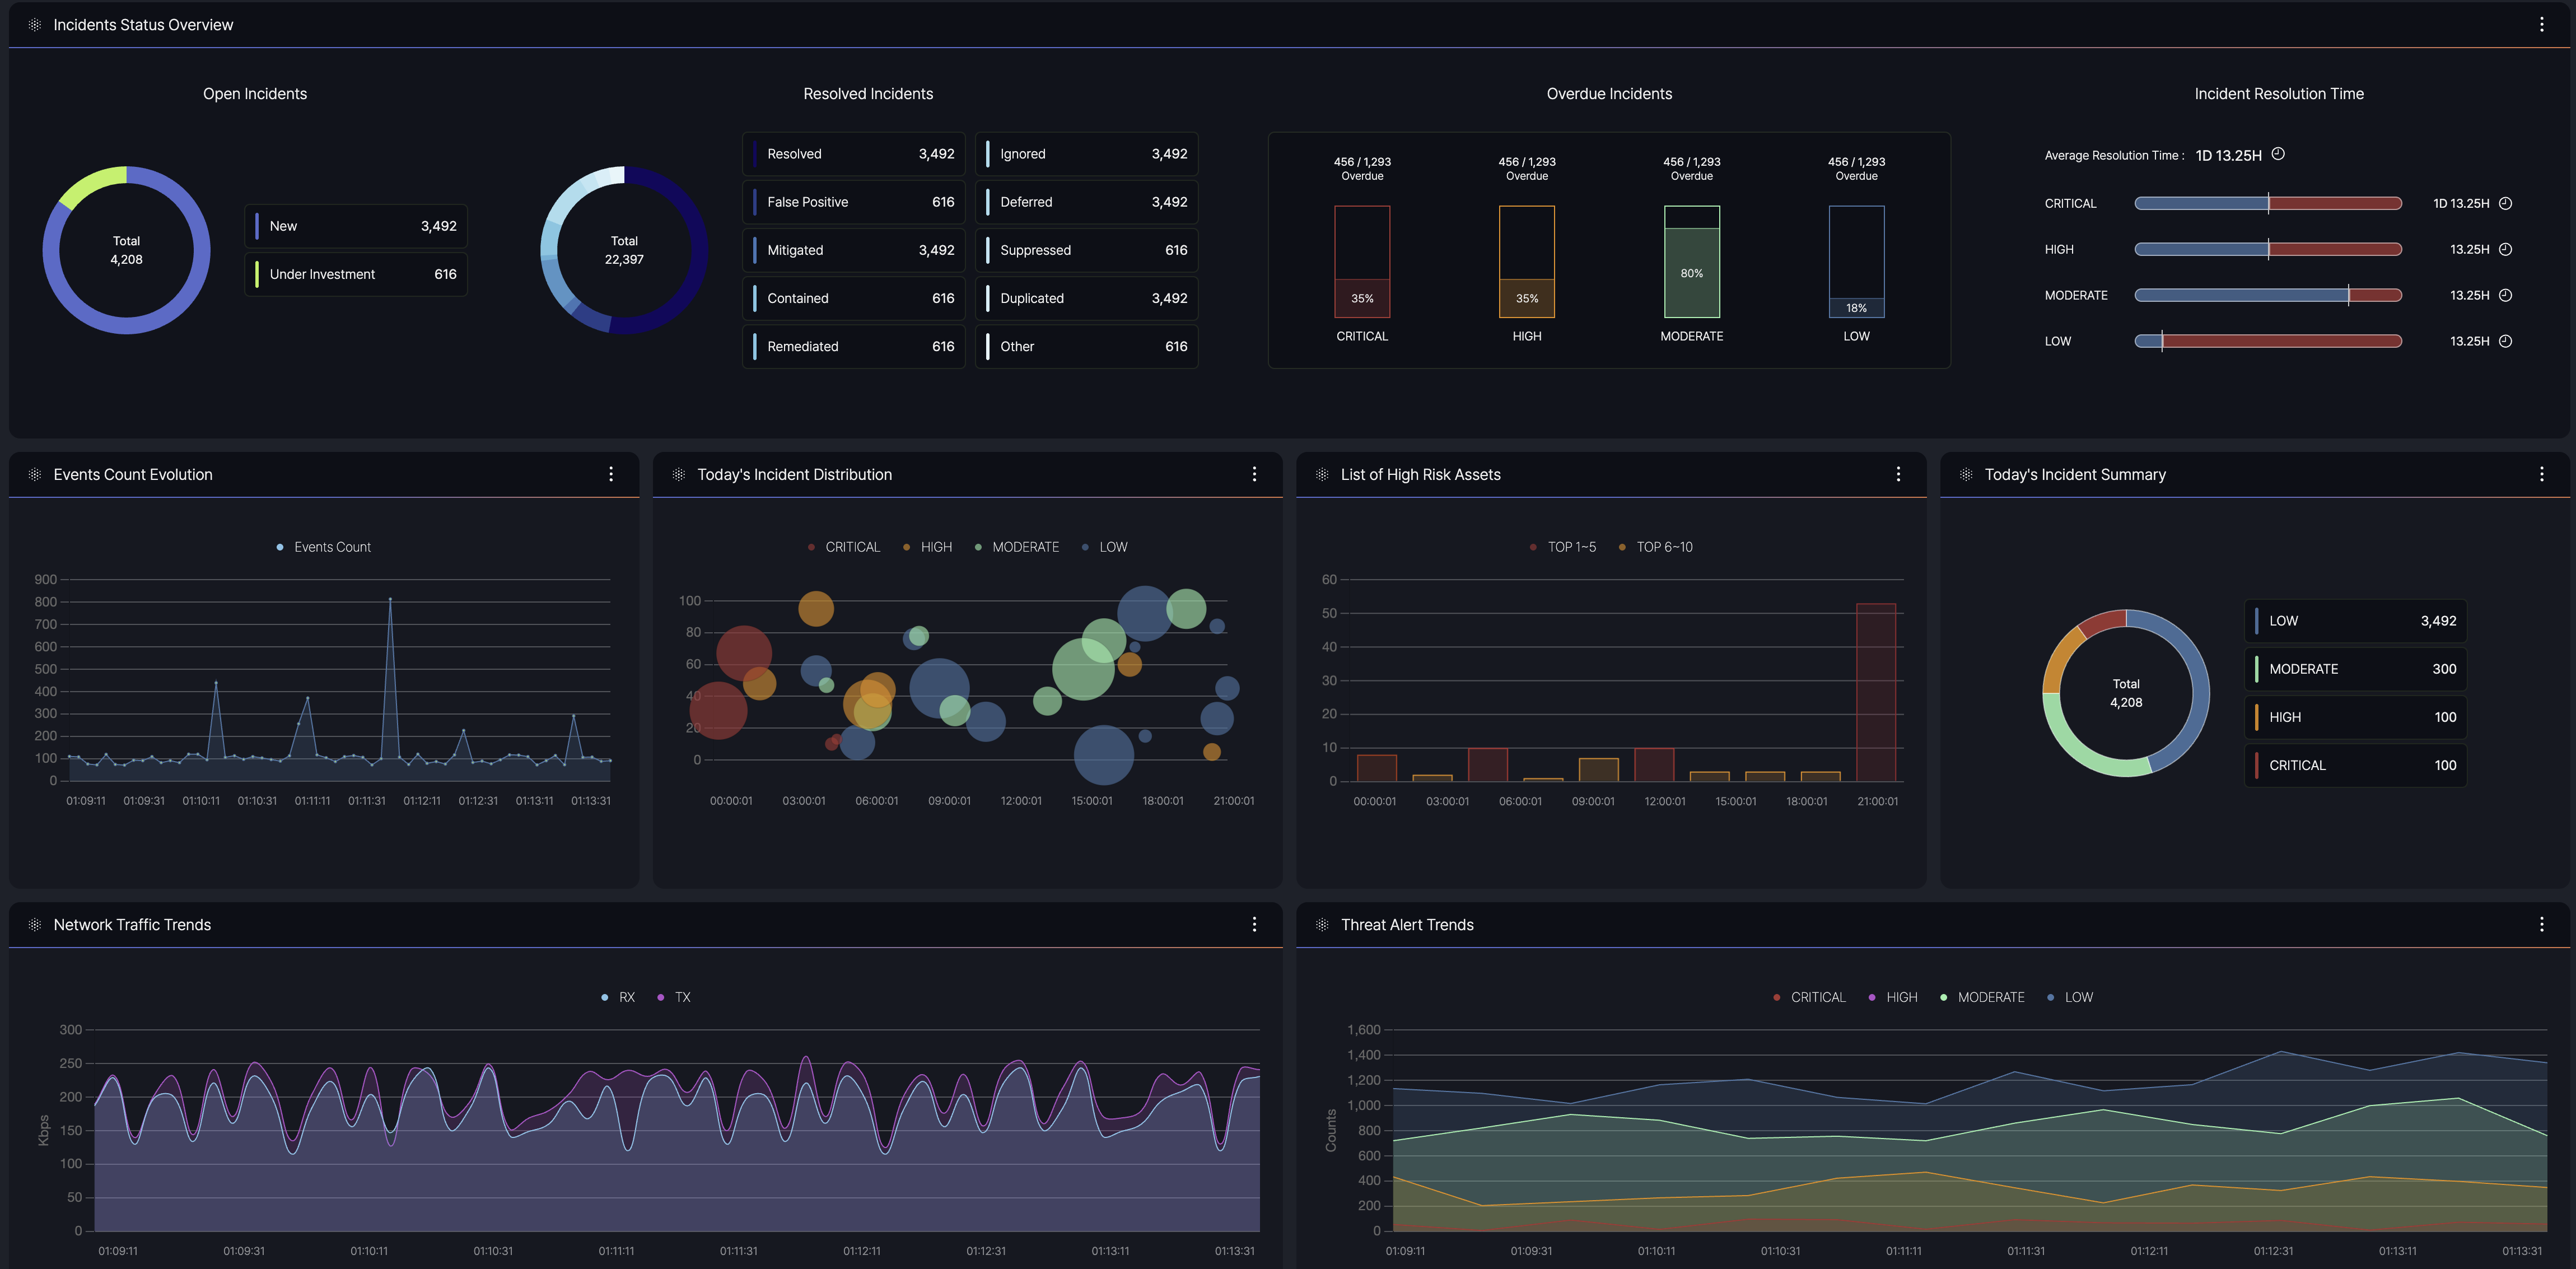
2. 구성은Agency SKT의Dashboard
SmartWAN의 모니터링 목적으로 구성되어 있음