Dashboard
Overview
The OpenSASE Dashboard provides a centralized, real-time interface for comprehensive security monitoring and management across hybrid IT environments.
Designed to integrate on-premises and cloud-based security data, the dashboard offers a unified view of an organization’s security posture, enabling proactive threat detection, alert management, and streamlined compliance tracking.
Getting Started
Logging In with an Accessible User Account
To begin, log in using a user account with access privileges.
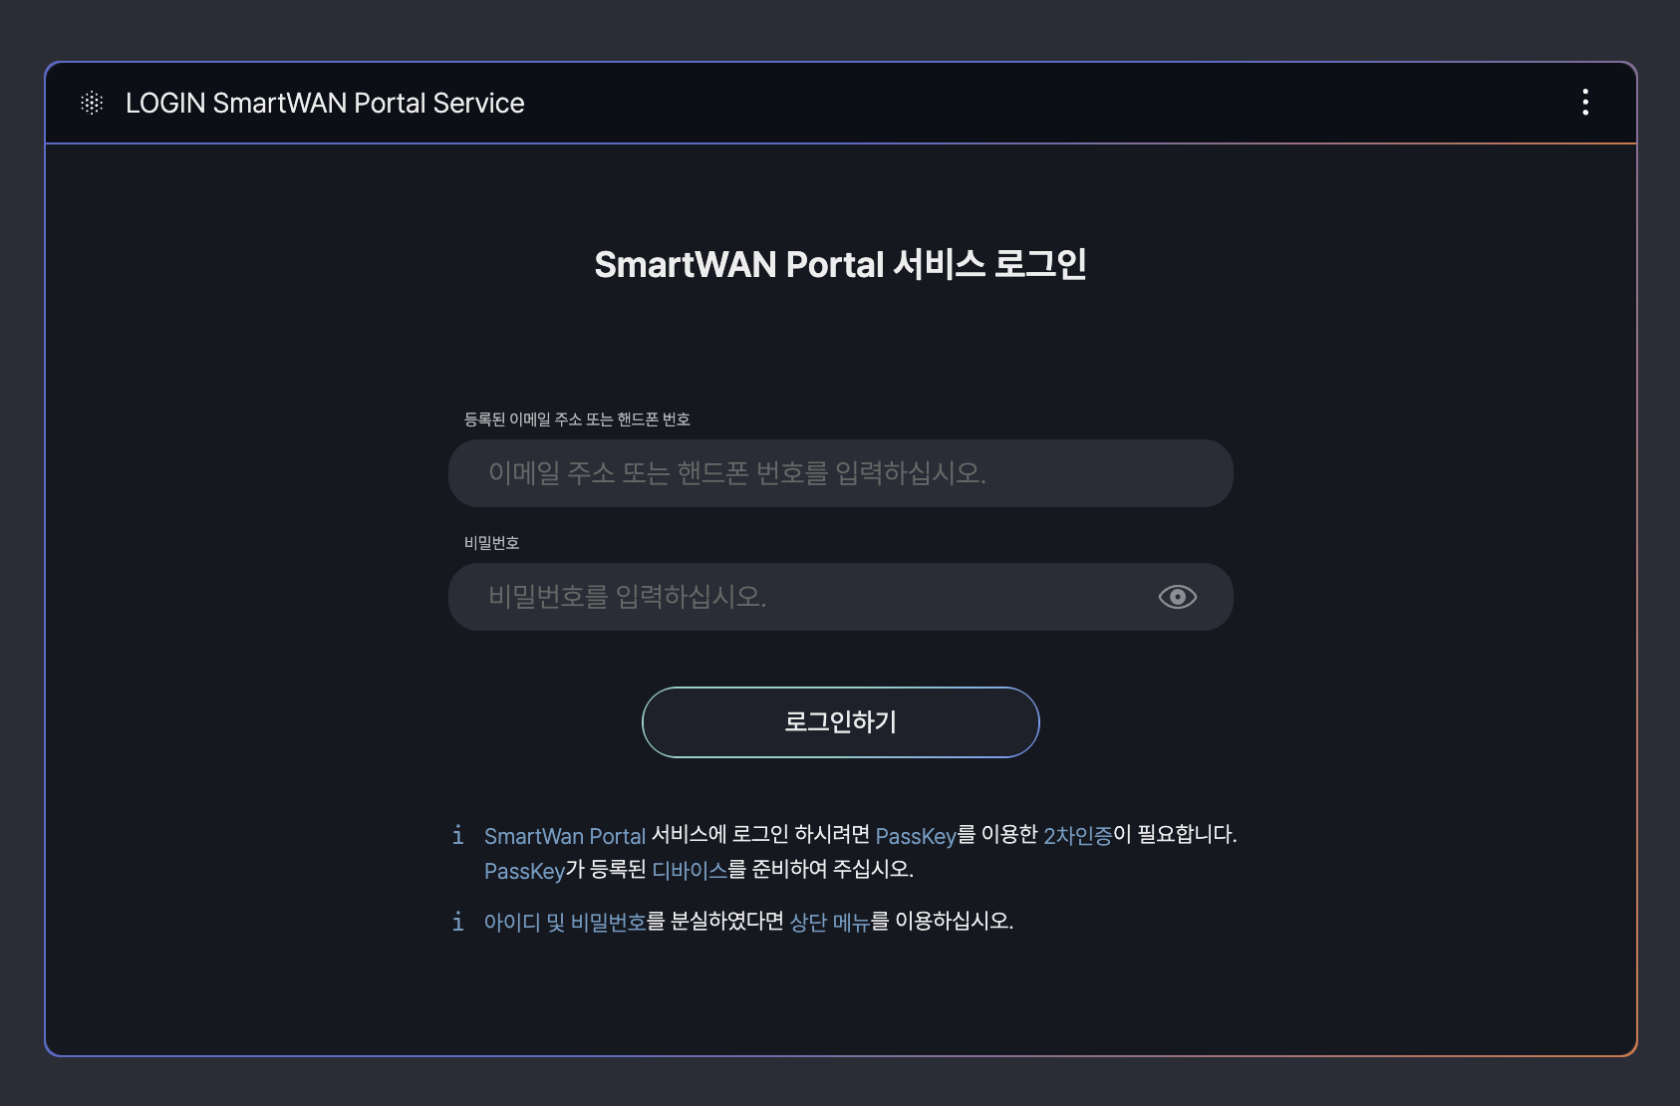
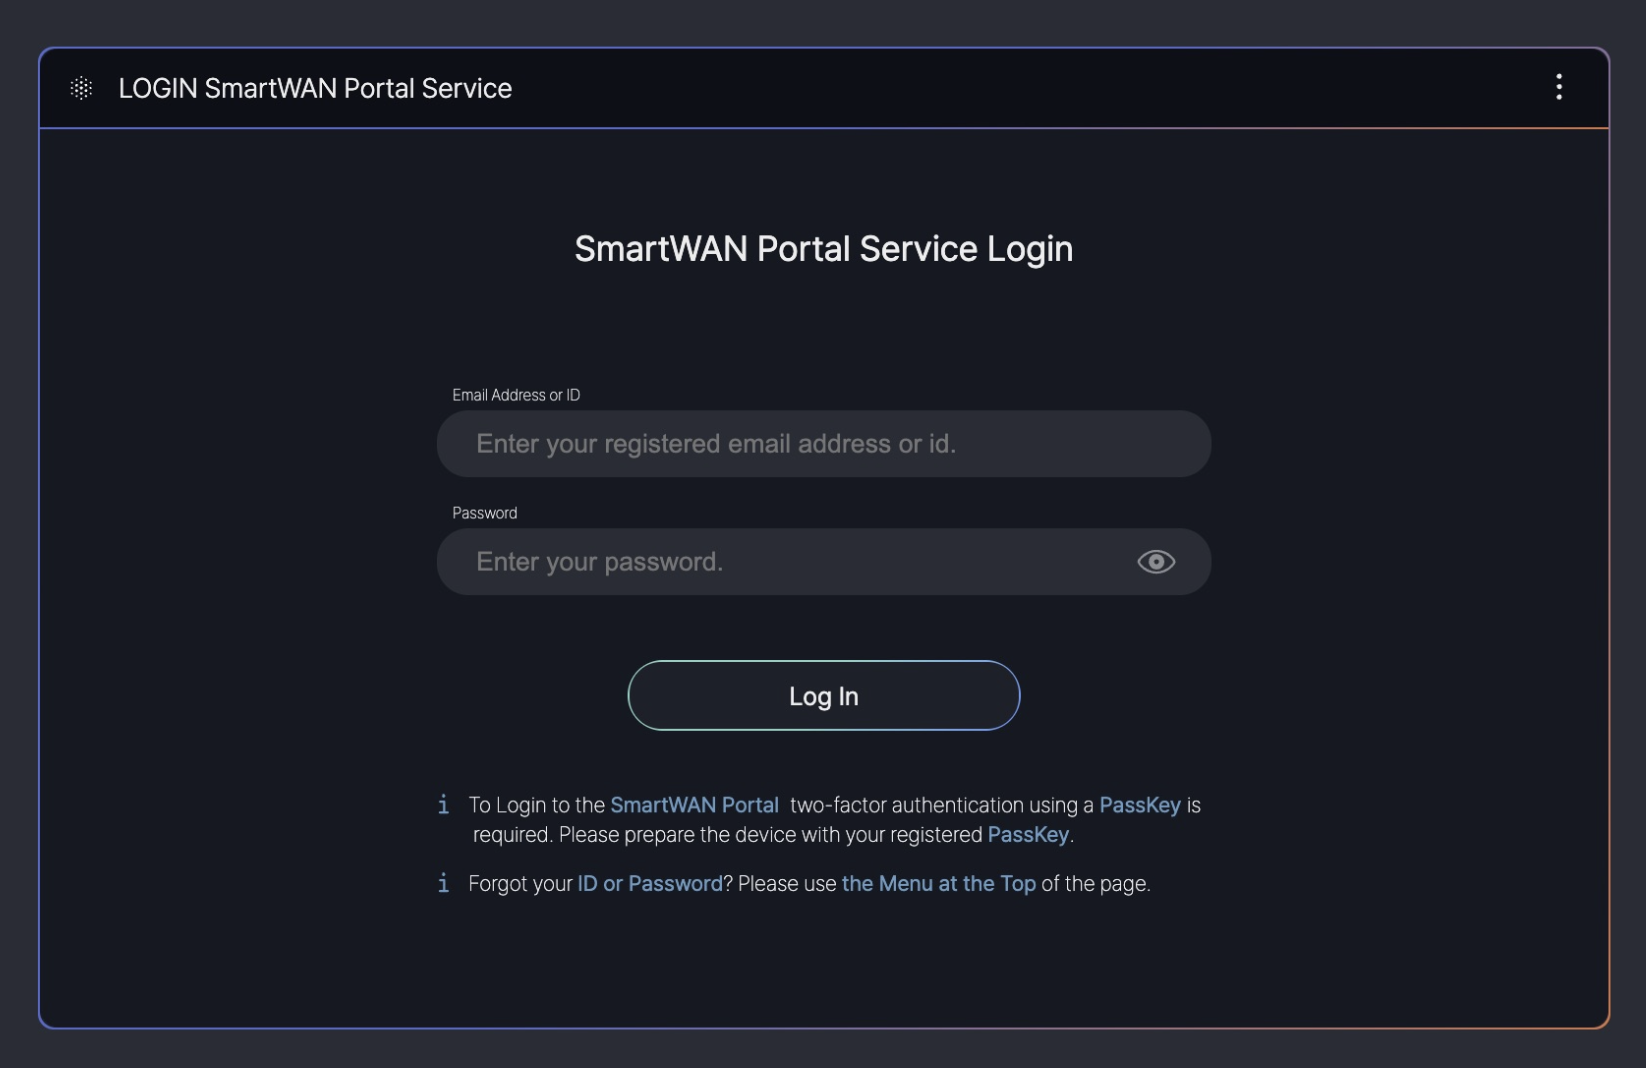
This guide is based on SKT’s SmartWAN Portal. Updates will be continuously applied to reflect future changes.
Pre-Configured Dashboards
The system currently offers three pre-configured dashboard types for users.
The visualization of data provided by the SmartWAN Portal is categorized into three distinct types. Upon accessing the SmartWAN Portal, the default landing page is fixed to the Agency Dashboard.
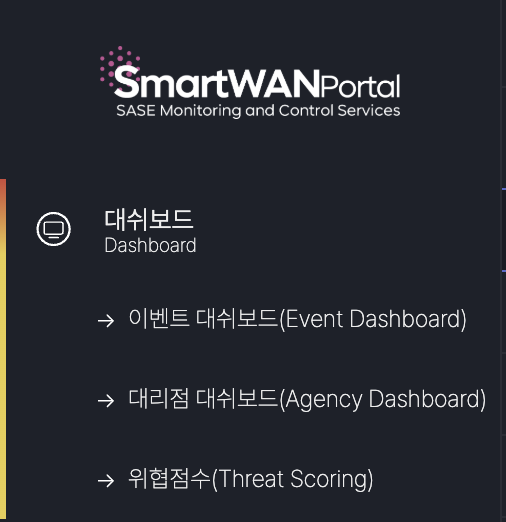
Currently, the dashboards are configured for the monitoring purposes of SKT’s agency SmartWAN system.
1. Event Dashboard (under development)
The Event Dashboard delivers aggregated information and status management insights for Incidents, Alerts, Threats, and other data collected from various data sources.
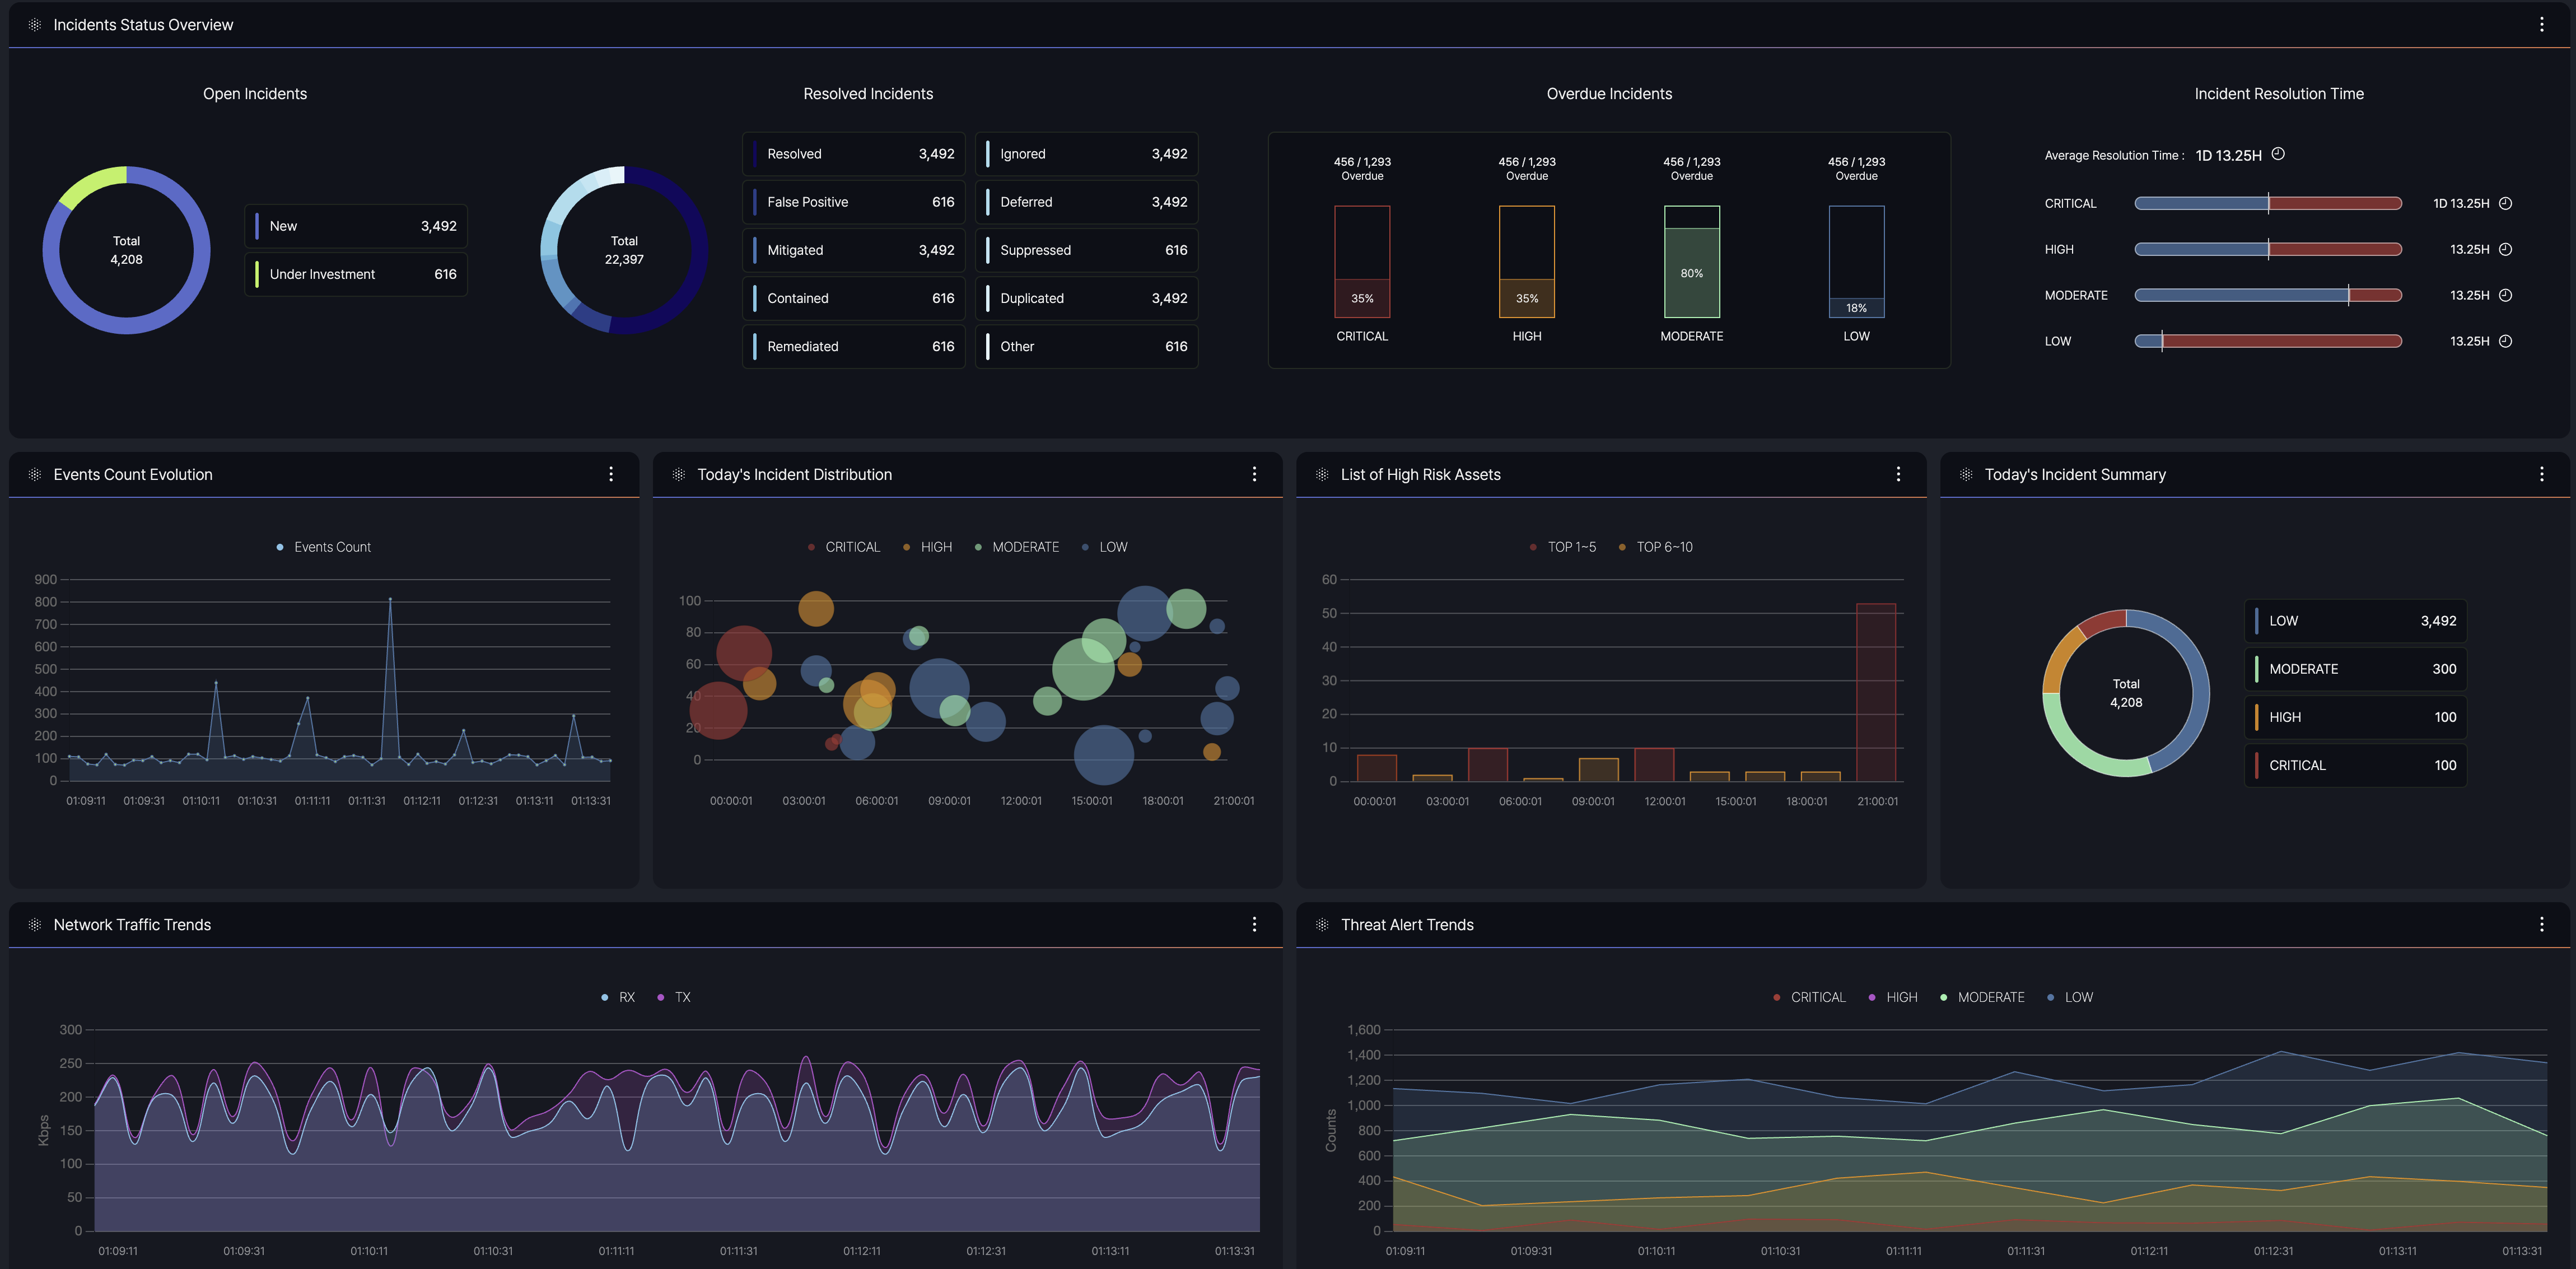
- Purpose: Provides a centralized view of security and network event data, enabling users to monitor and manage incidents effectively.
- Data Sources: Integrates information from multiple origins, including agents, agentless systems, and external feeds.
- Key Information: Displays summaries of event counts, severity levels, and current statuses to facilitate quick decision-making.
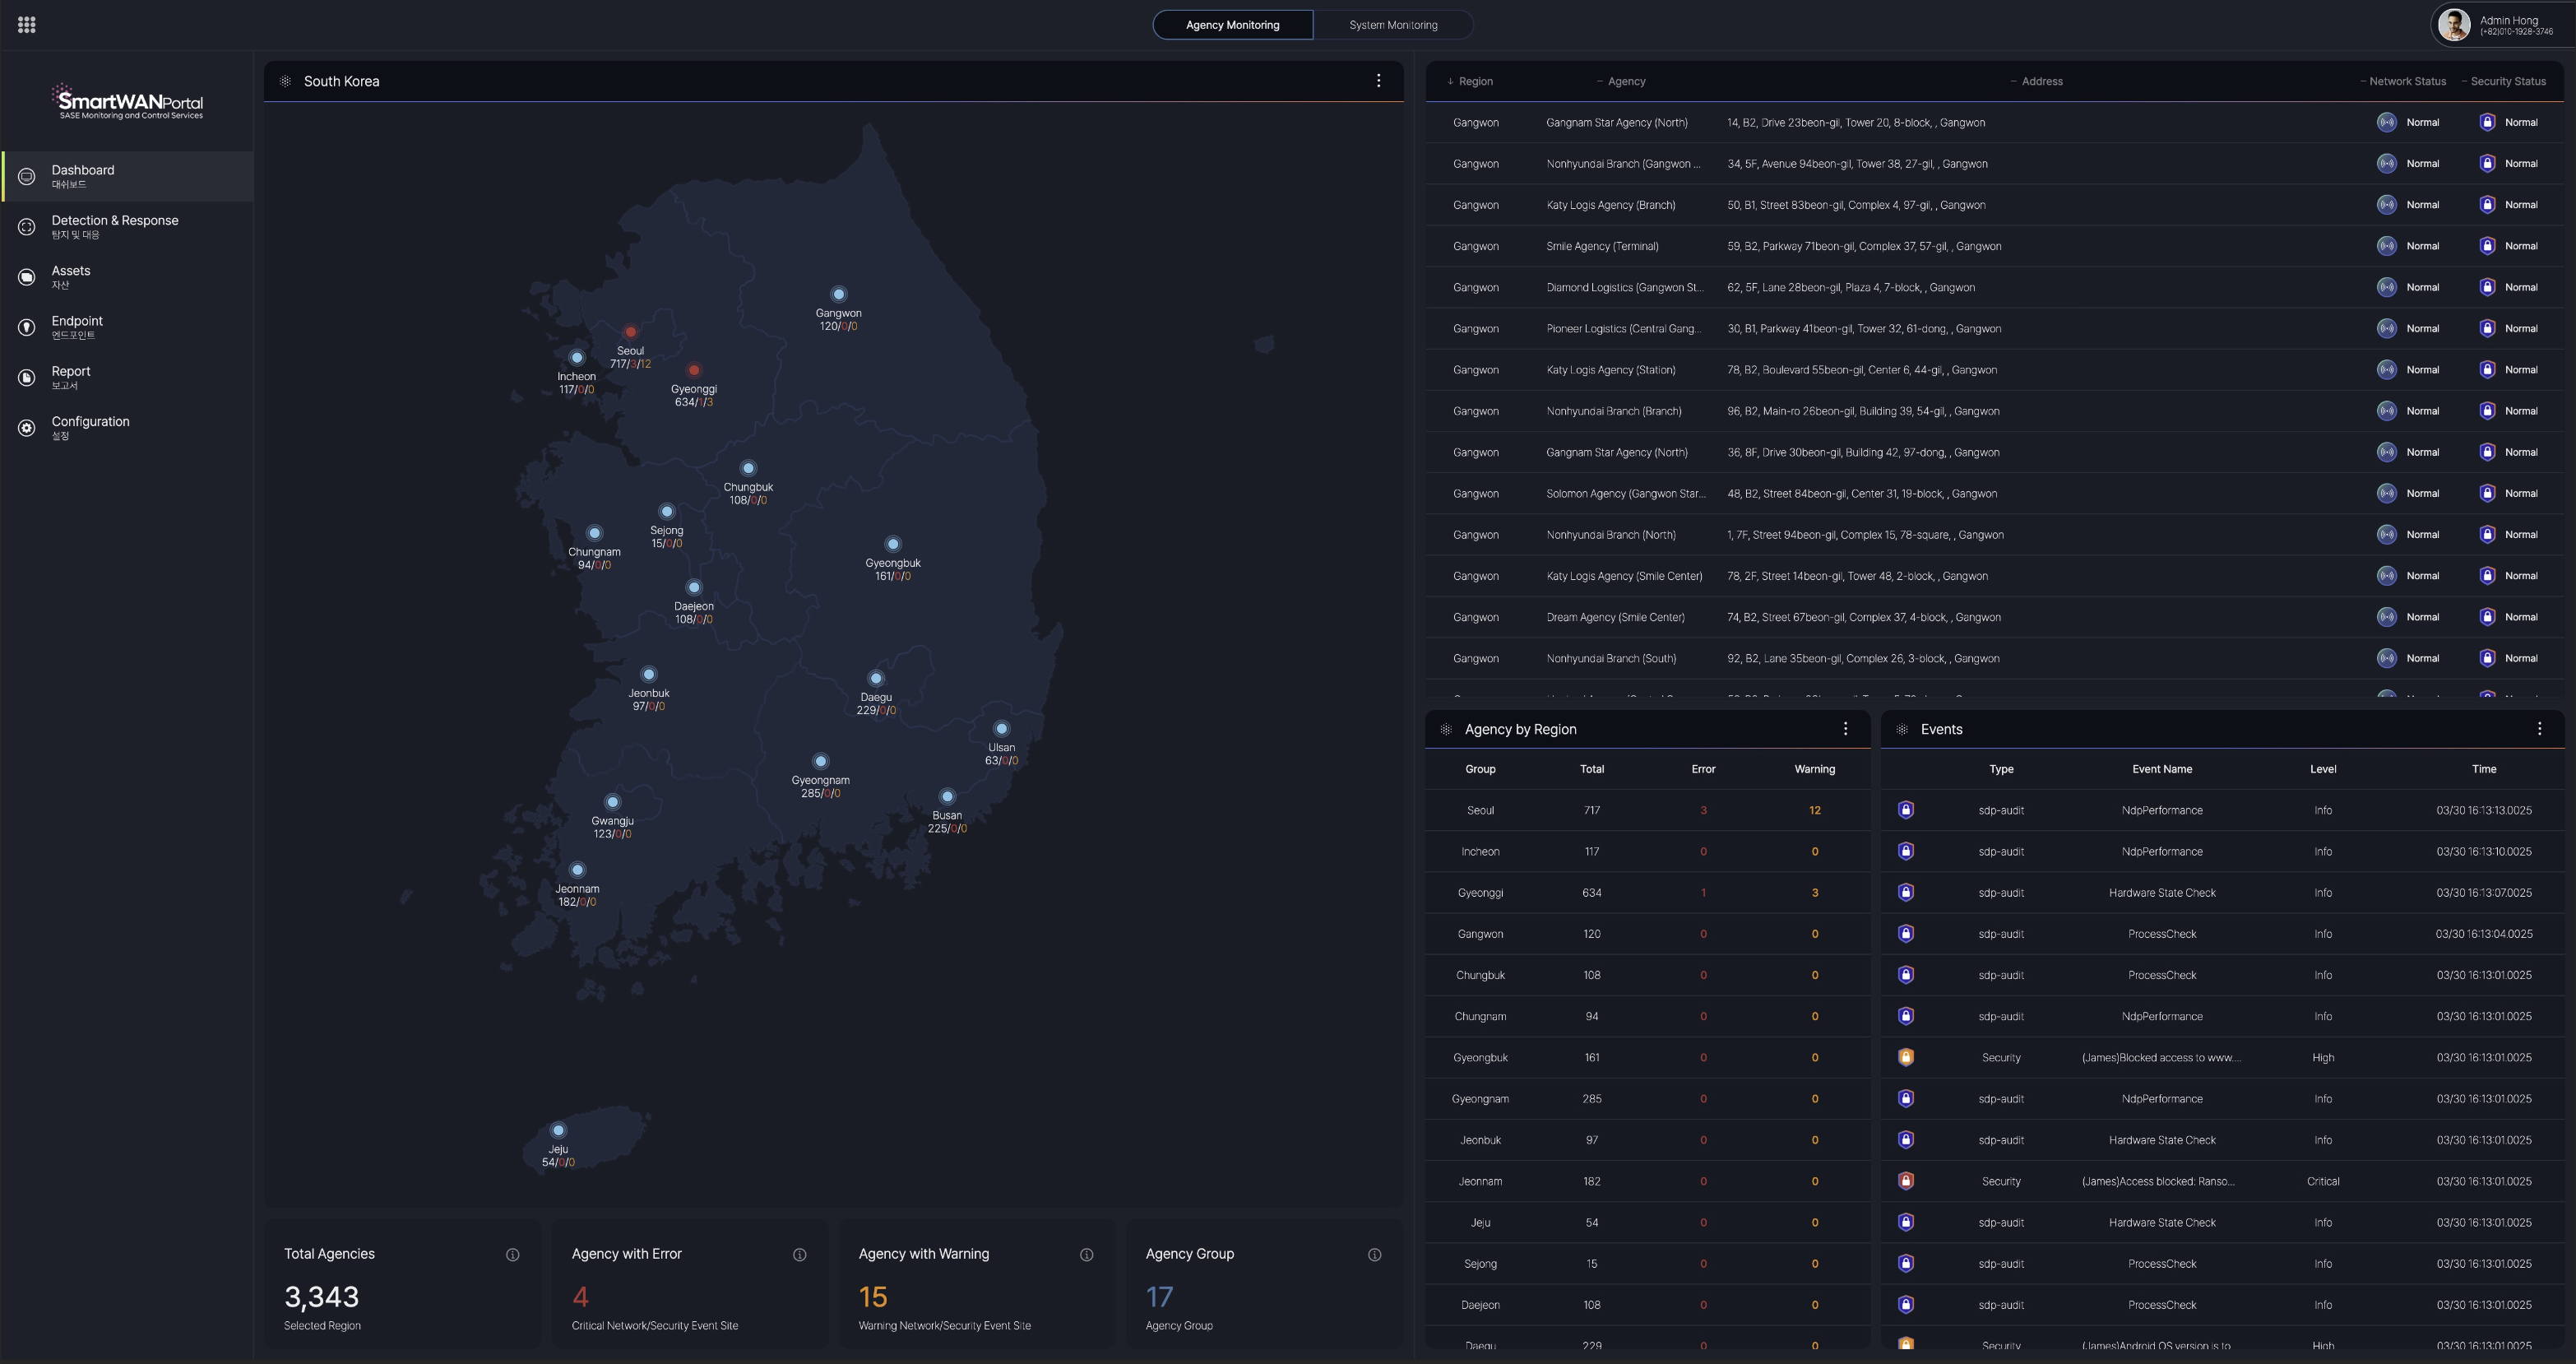
2. Agency Dashboard
The Agency Dashboard provides visualized status information on network and security events for agencies where SmartWAN CPE (Customer Premises Equipment) is installed, displayed through an interactive map interface.
There are 2 monitor dashboards
- Agency monitoring
- System monitoring

Agency monitoring
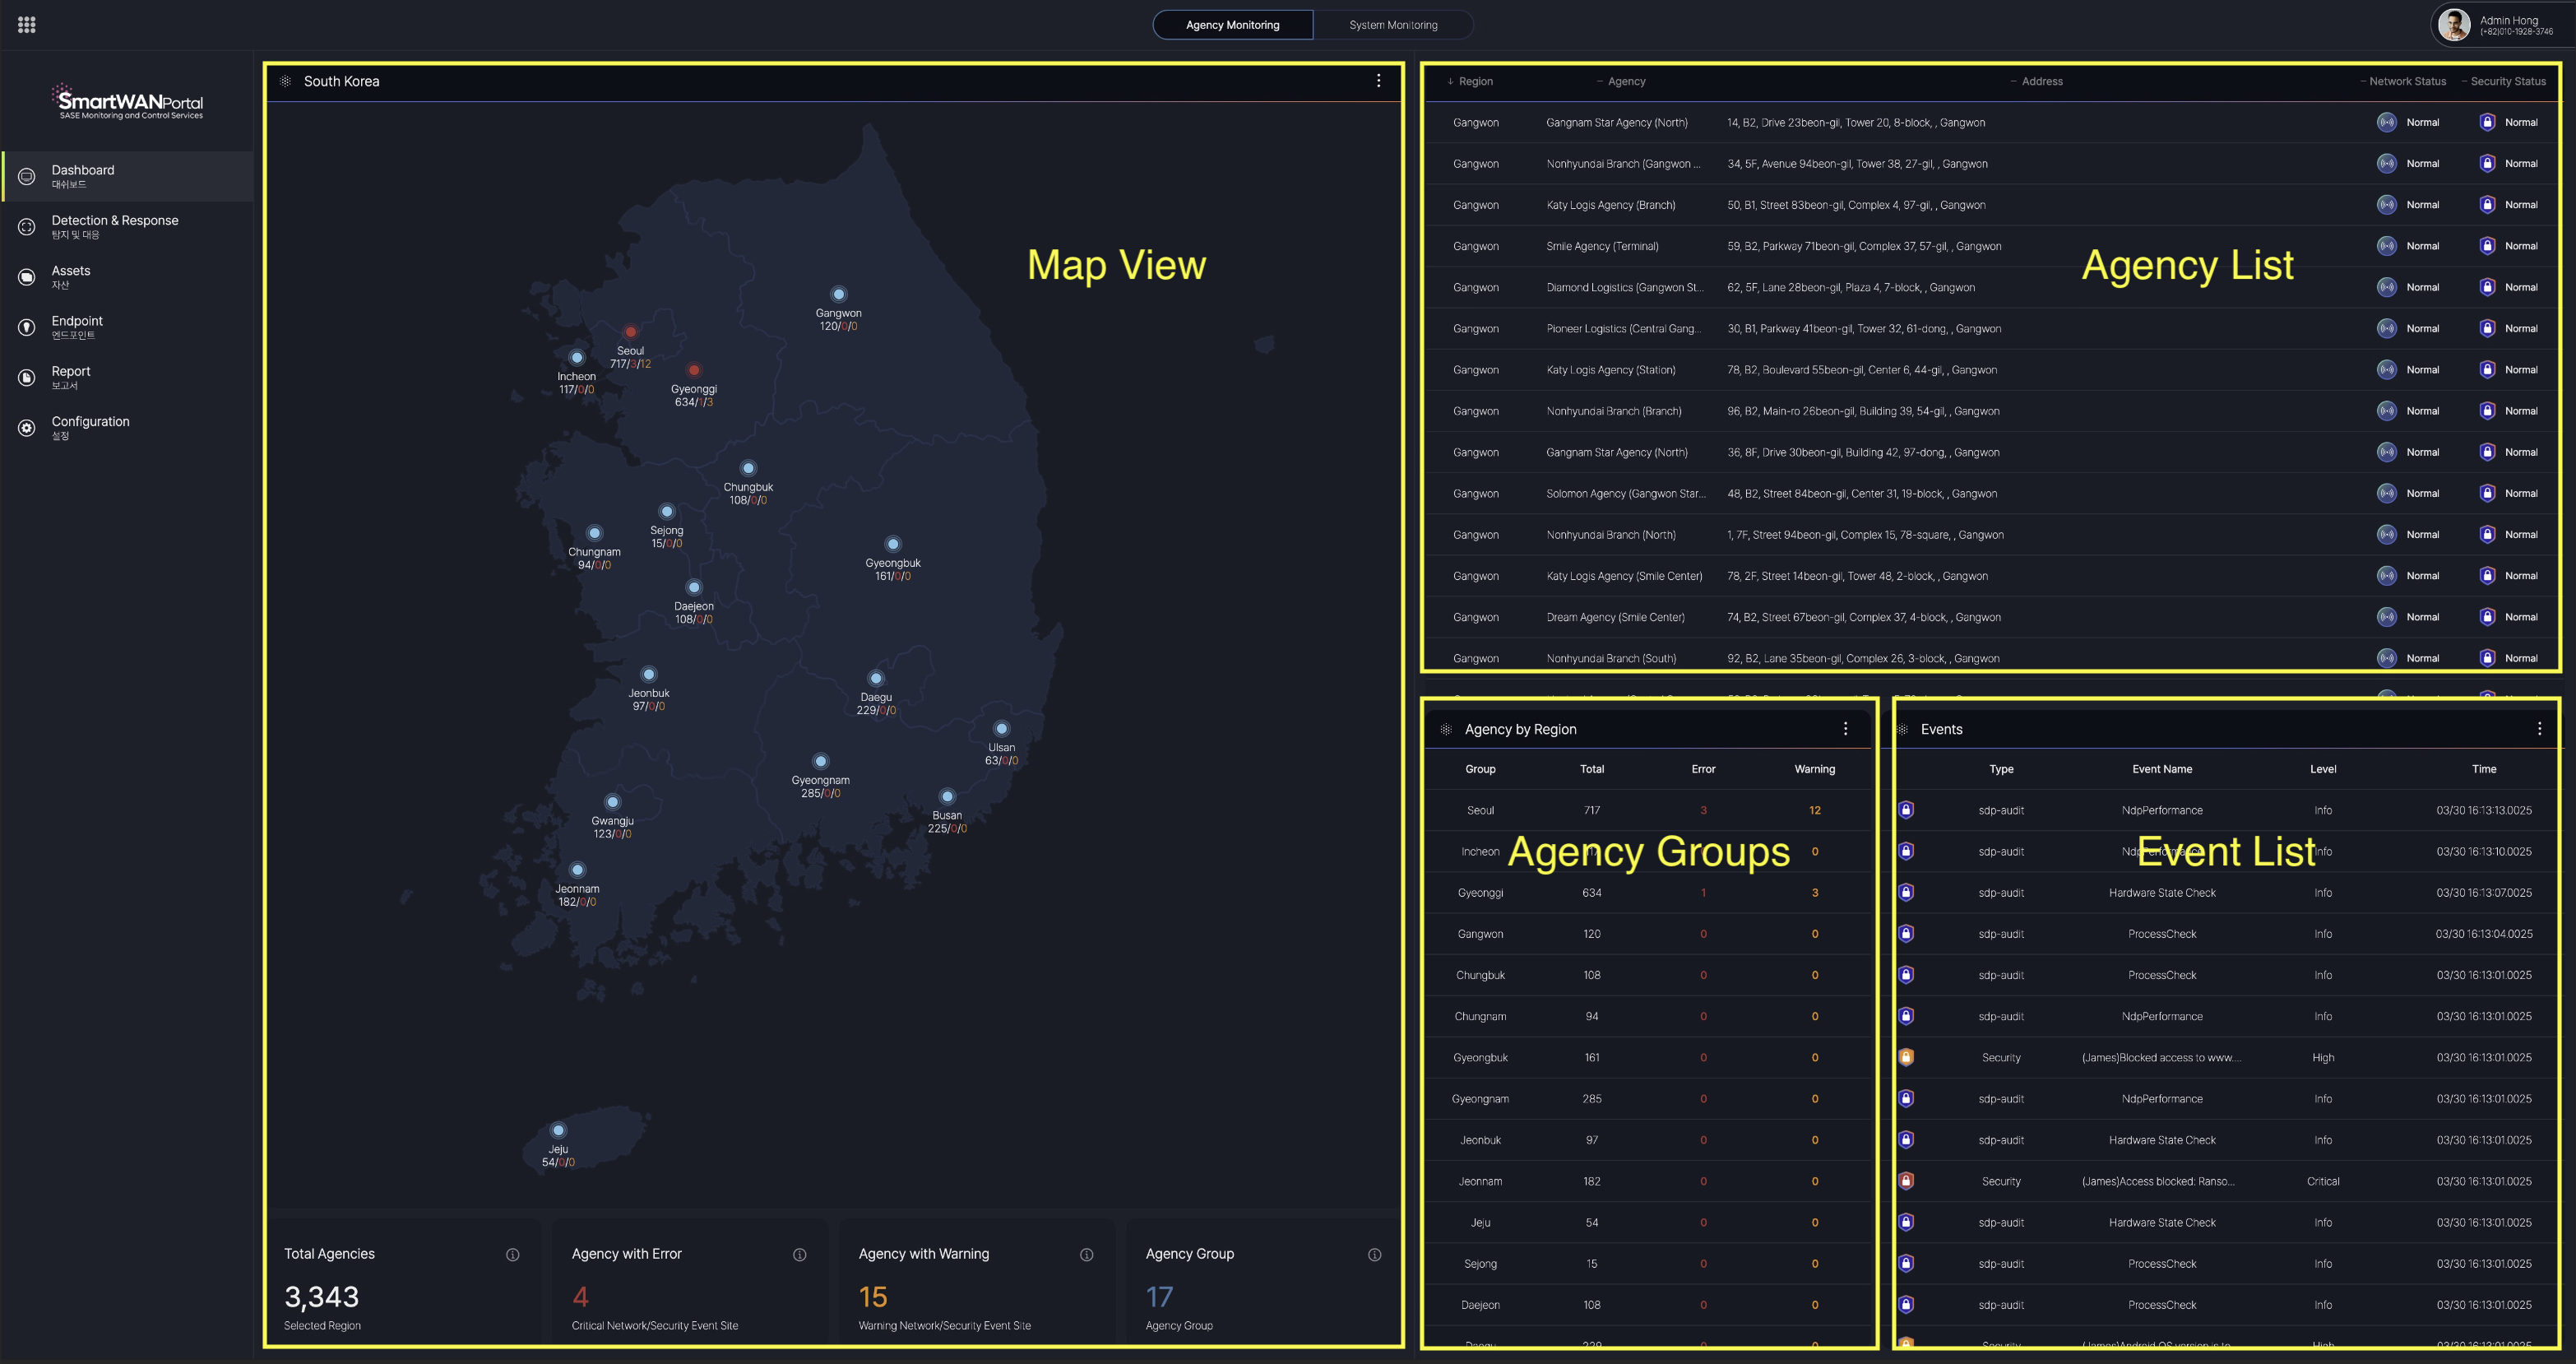
Map View
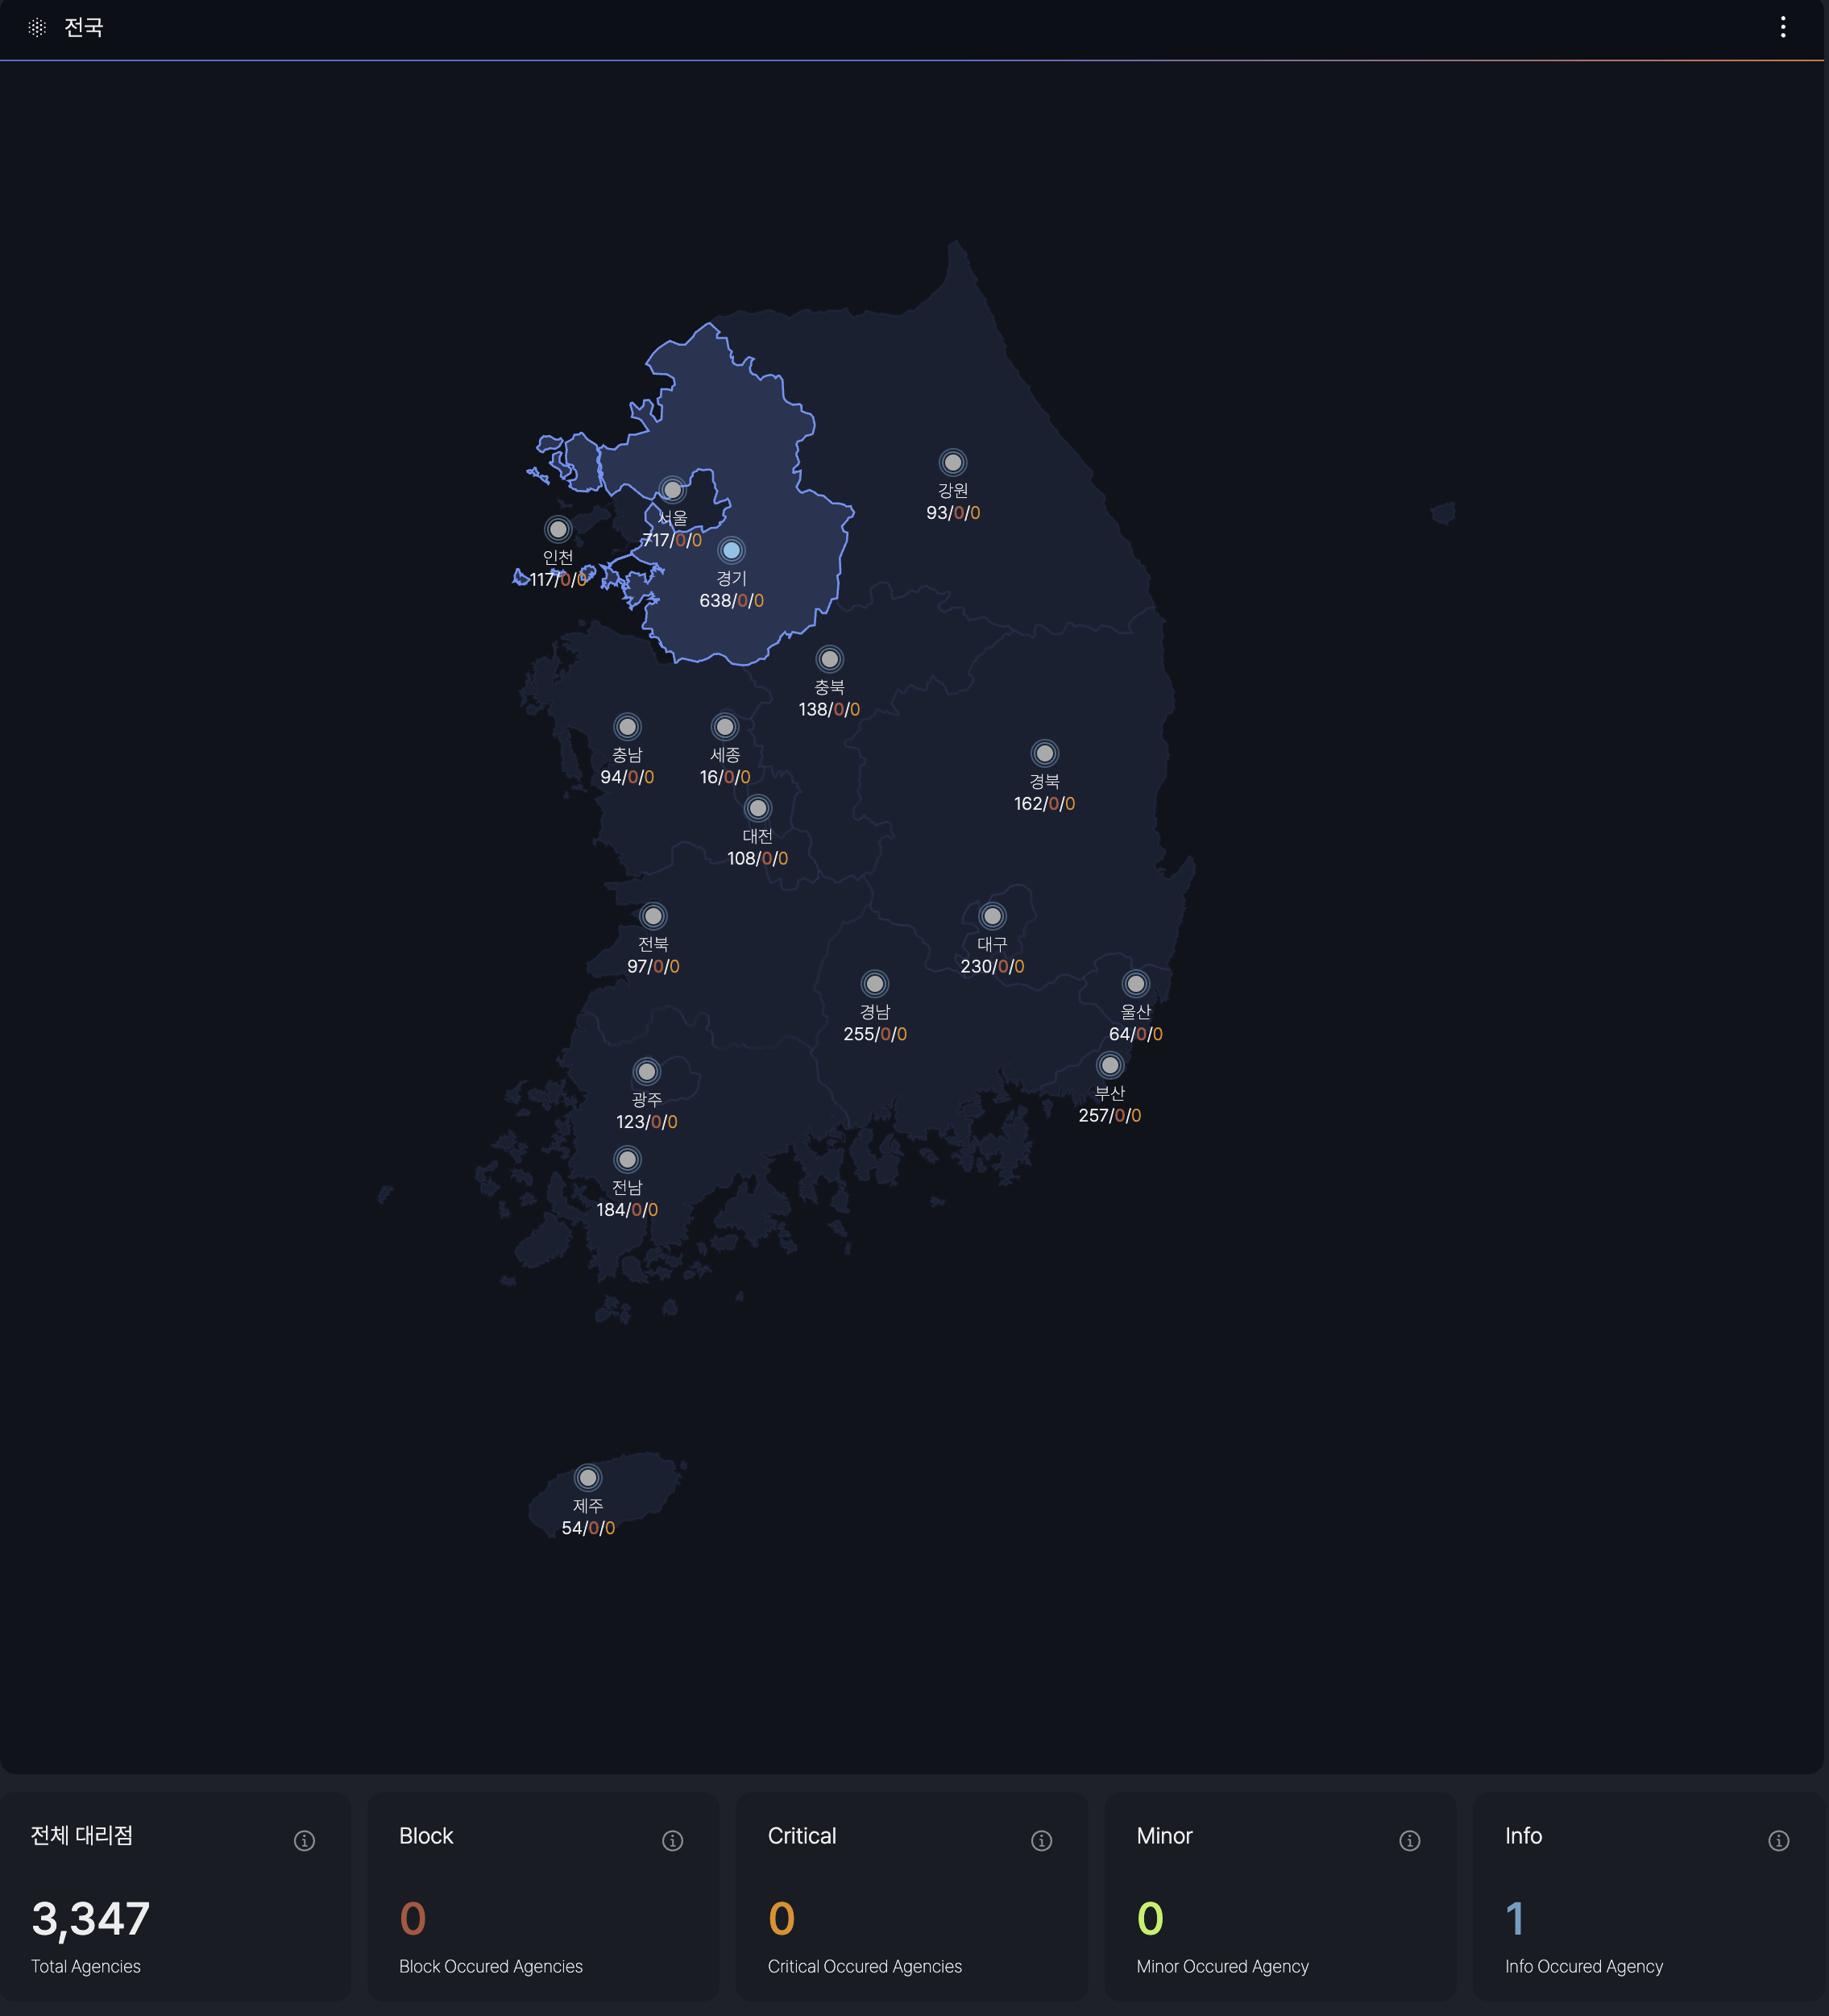
This view offers a comprehensive overview of all agency locations and detailed information segmented by major cities. It aggregates and classifies network and security events into four categories. Block, Critical, Minor, and Info.
Event levels are defined by SKT's requirements.
Agency List
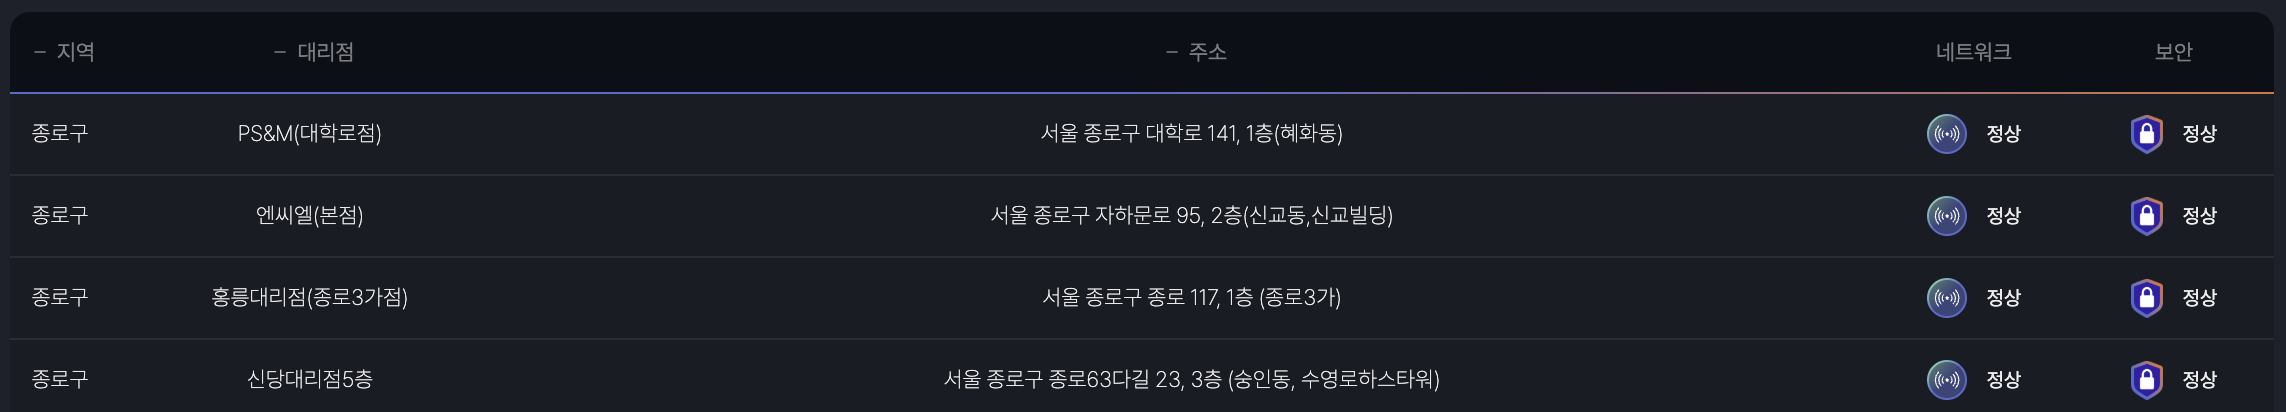
When a specific region is selected in the Map View, the dashboard displays a list of agencies registered in that region, along with detailed information on the Network Status (CPE) and Security Status (SDP) for each agency.
- Agency List: A comprehensive roster of agencies within the selected region.
- Network Status (CPE): Provides the current operational status of the Customer Premises Equipment for each agency.
- Security Status (SDP): Details the security posture, including Software-Defined Perimeter (SDP) metrics, for each agency.
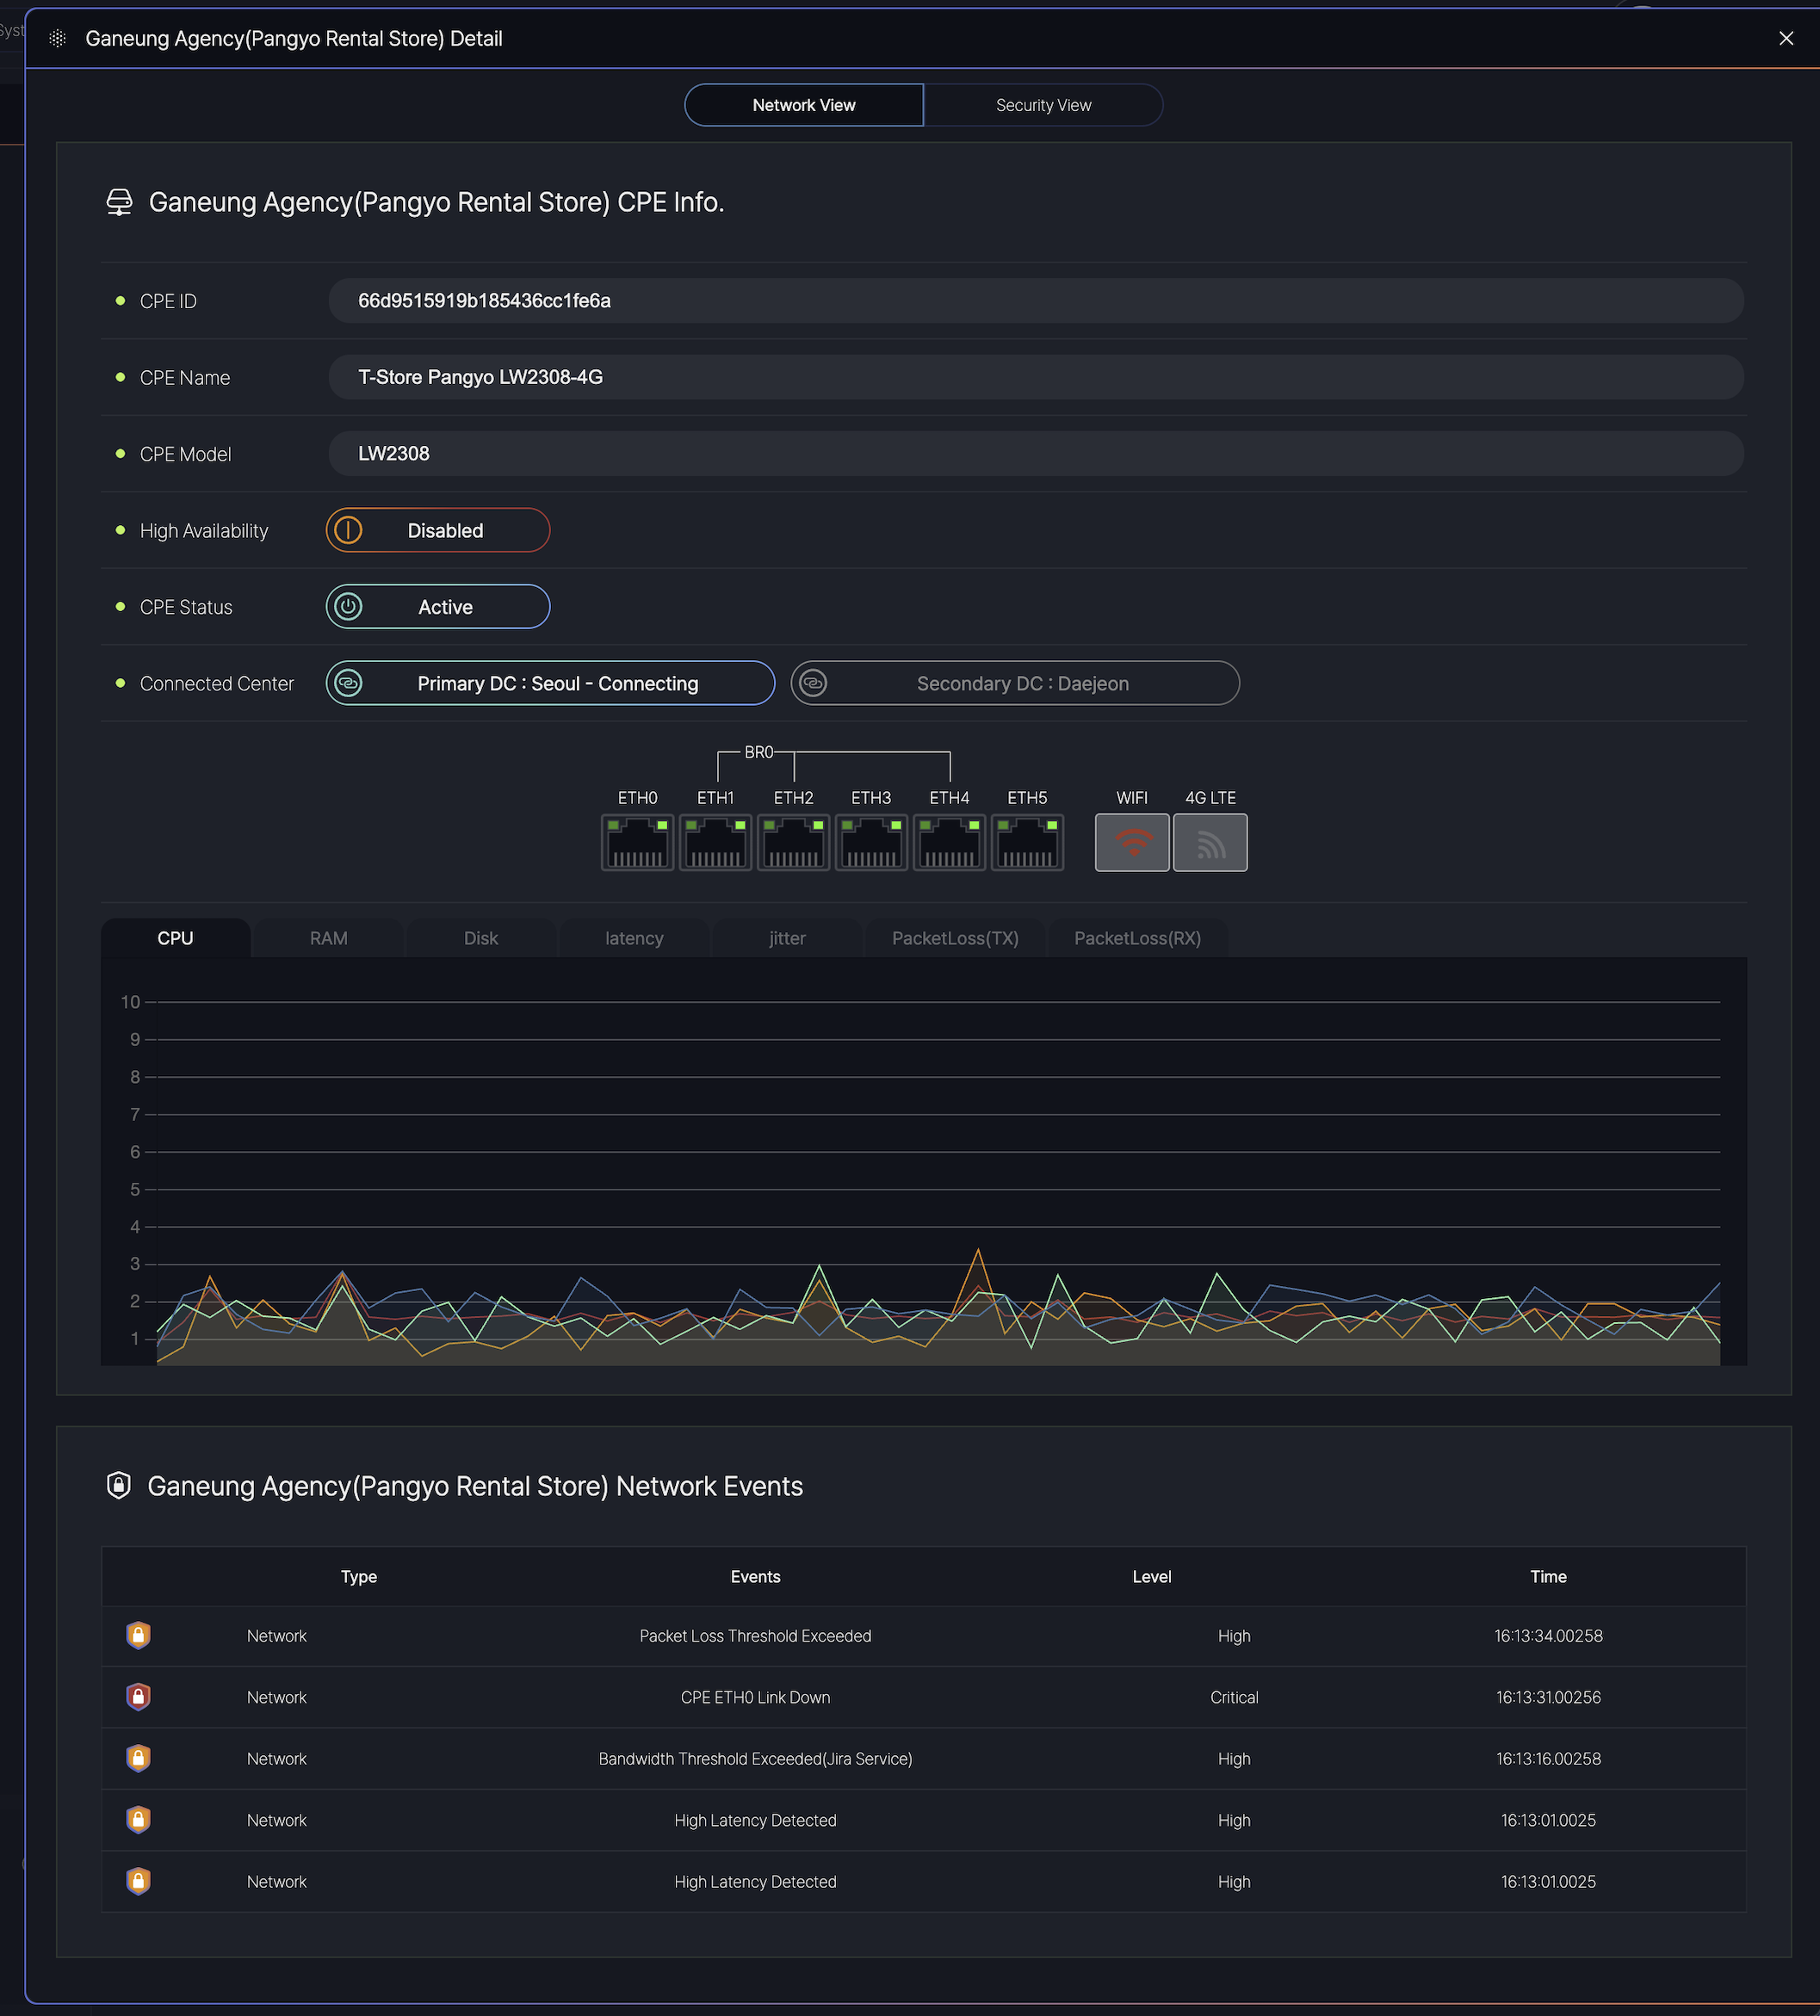
View details of the agency
Agency Groups
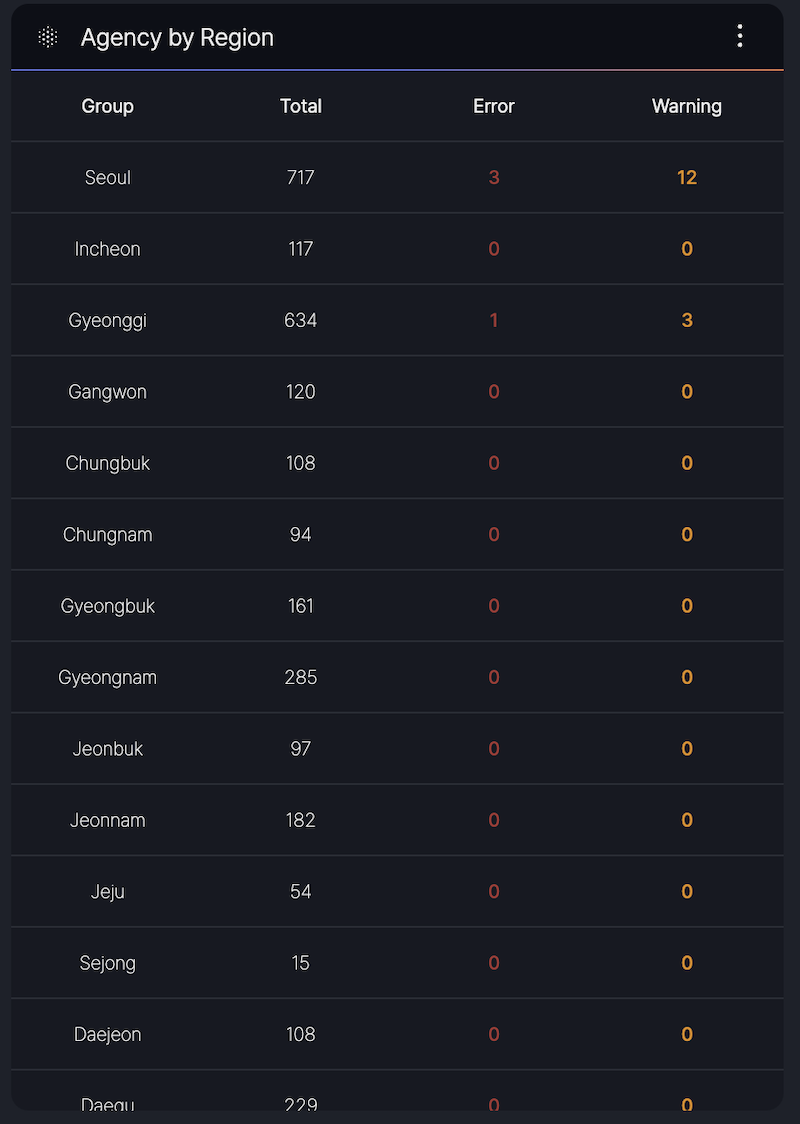
The Agency Group section provides a summary of agency counts per region and detailed status information for CPE.
- Region-Based Counts: Displays the total number of agencies in each region.
- CPE Status Info: Offers insights into the operational status of CPE devices across the agencies
Event List
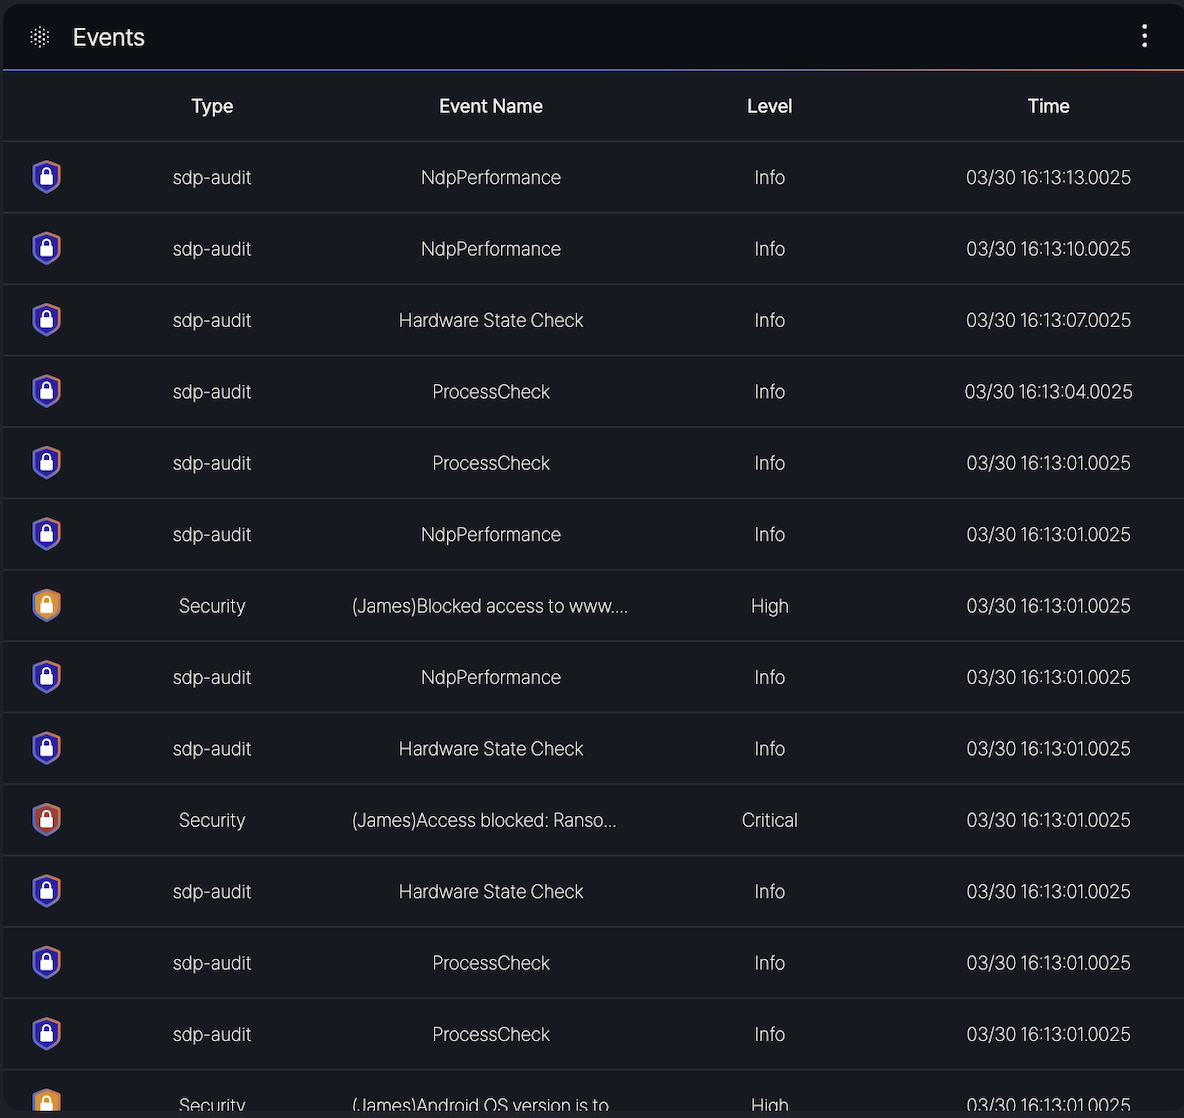
The Event List section displays a table of recent events, providing detailed information including the event type, name, severity level, and timestamp for all recorded incidents.
Columns:
- Type: Indicates the category of the event (e.g., sdp-audit, Security).
- Event Name: Specifies the event description (e.g., NdpPerformance, Hardware State Check, ProcessCheck, or security-related messages like [JAMES] Blocked access to www…).
- Level: Denotes the severity of the event, categorized as Info, Minor, or Critical, Block.
- Time: Shows the timestamp of the event in the format MM/DD HH:MM:SS.milliseconds (e.g., 03/30 16:13:00.025).
- sdp-audit events such as NdpPerformance and Hardware State Check with Info level.
- Security events like [JAMES] Access blocked: Rans… with Critical level or [JAMES] Android OS version is to… with High level.