Dashboard
Overview
Getting Started
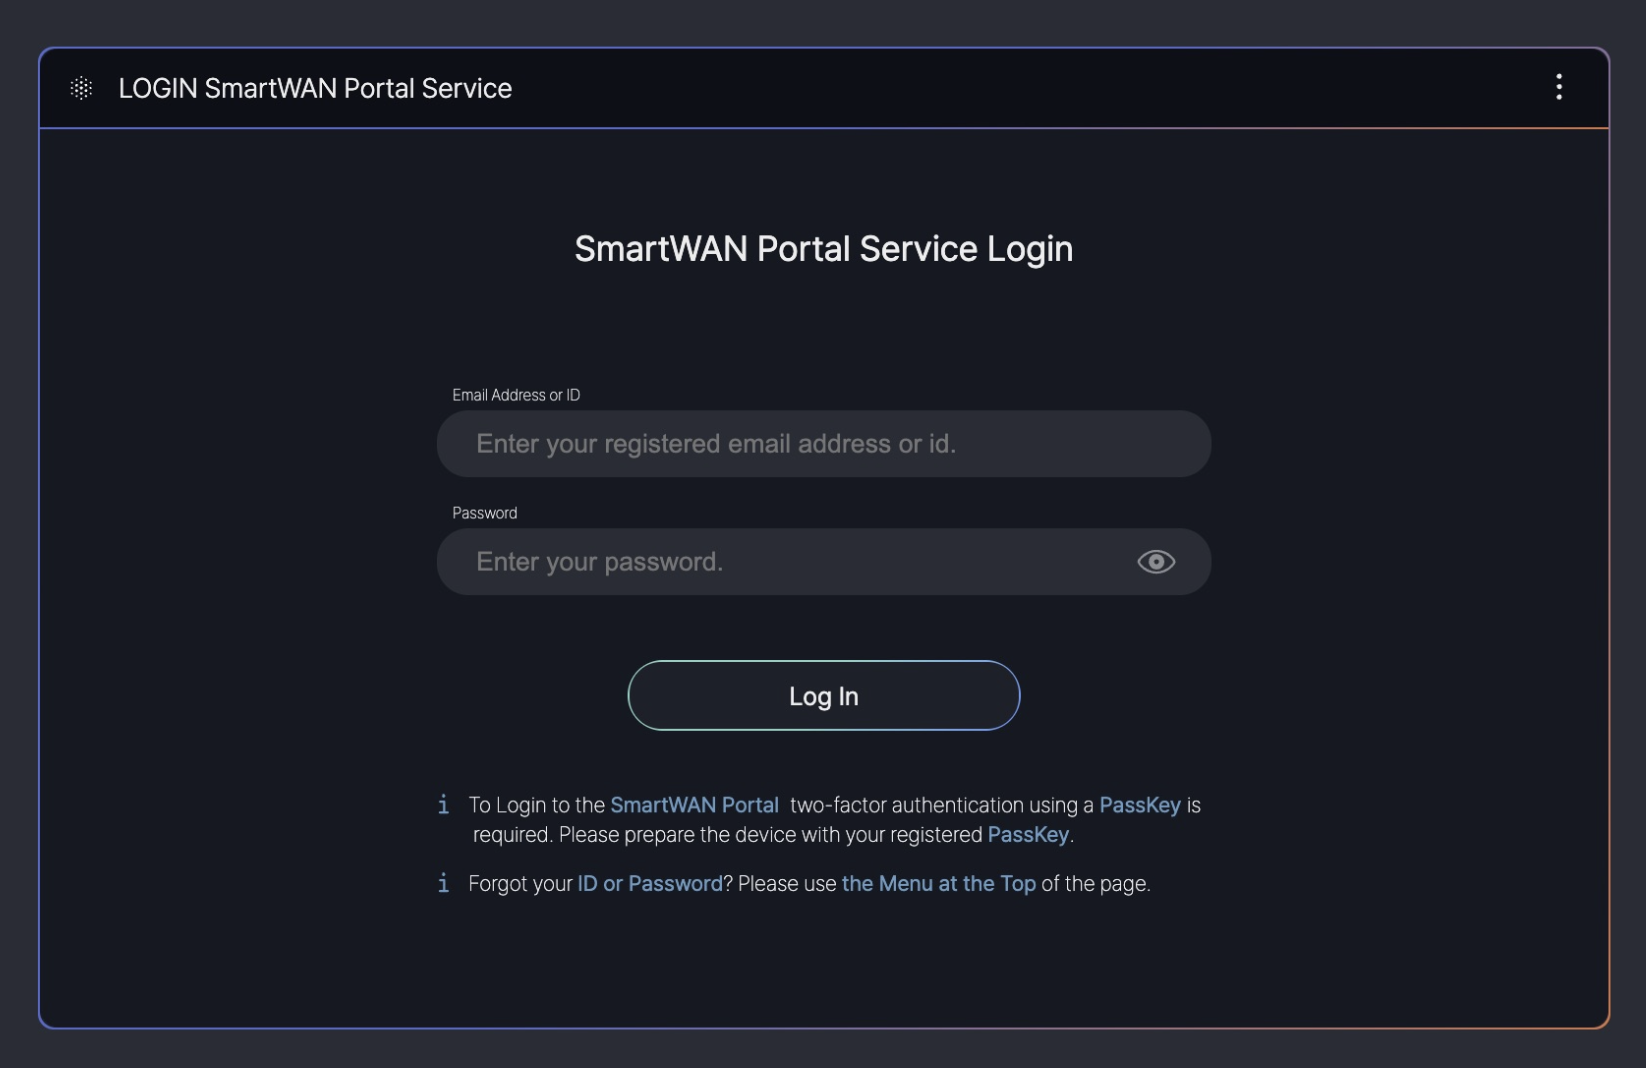
Logging In with an Accessible User Account
To begin, log in using a user account with access privileges.
This guide is based on SKT’s SmartWAN Portal. Updates will be continuously applied to reflect future changes.
Pre-Configured Dashboards
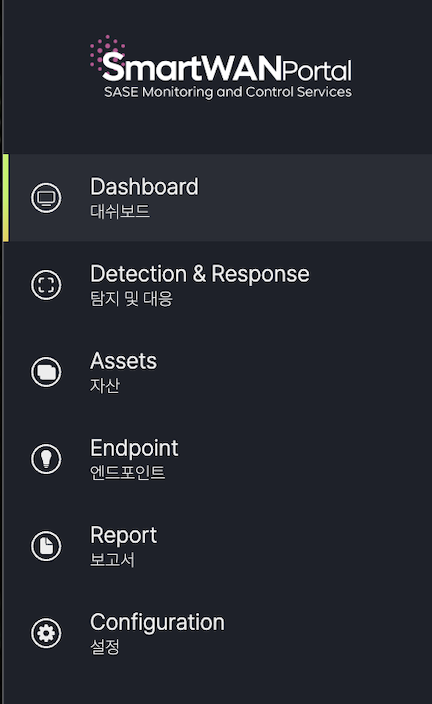
Currently, the dashboards are configured for the monitoring purposes of SKT’s agency SmartWAN system.
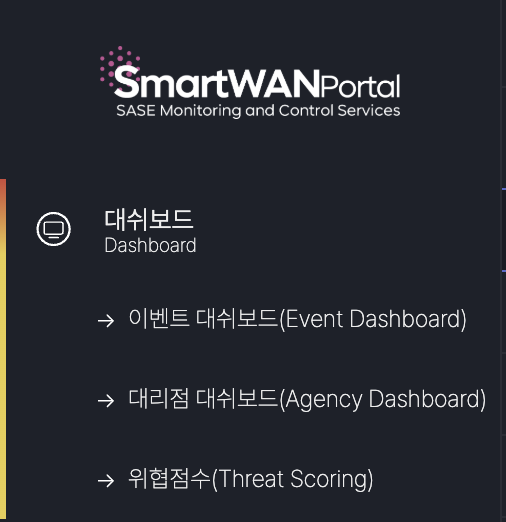
Event Dashboard (under development)
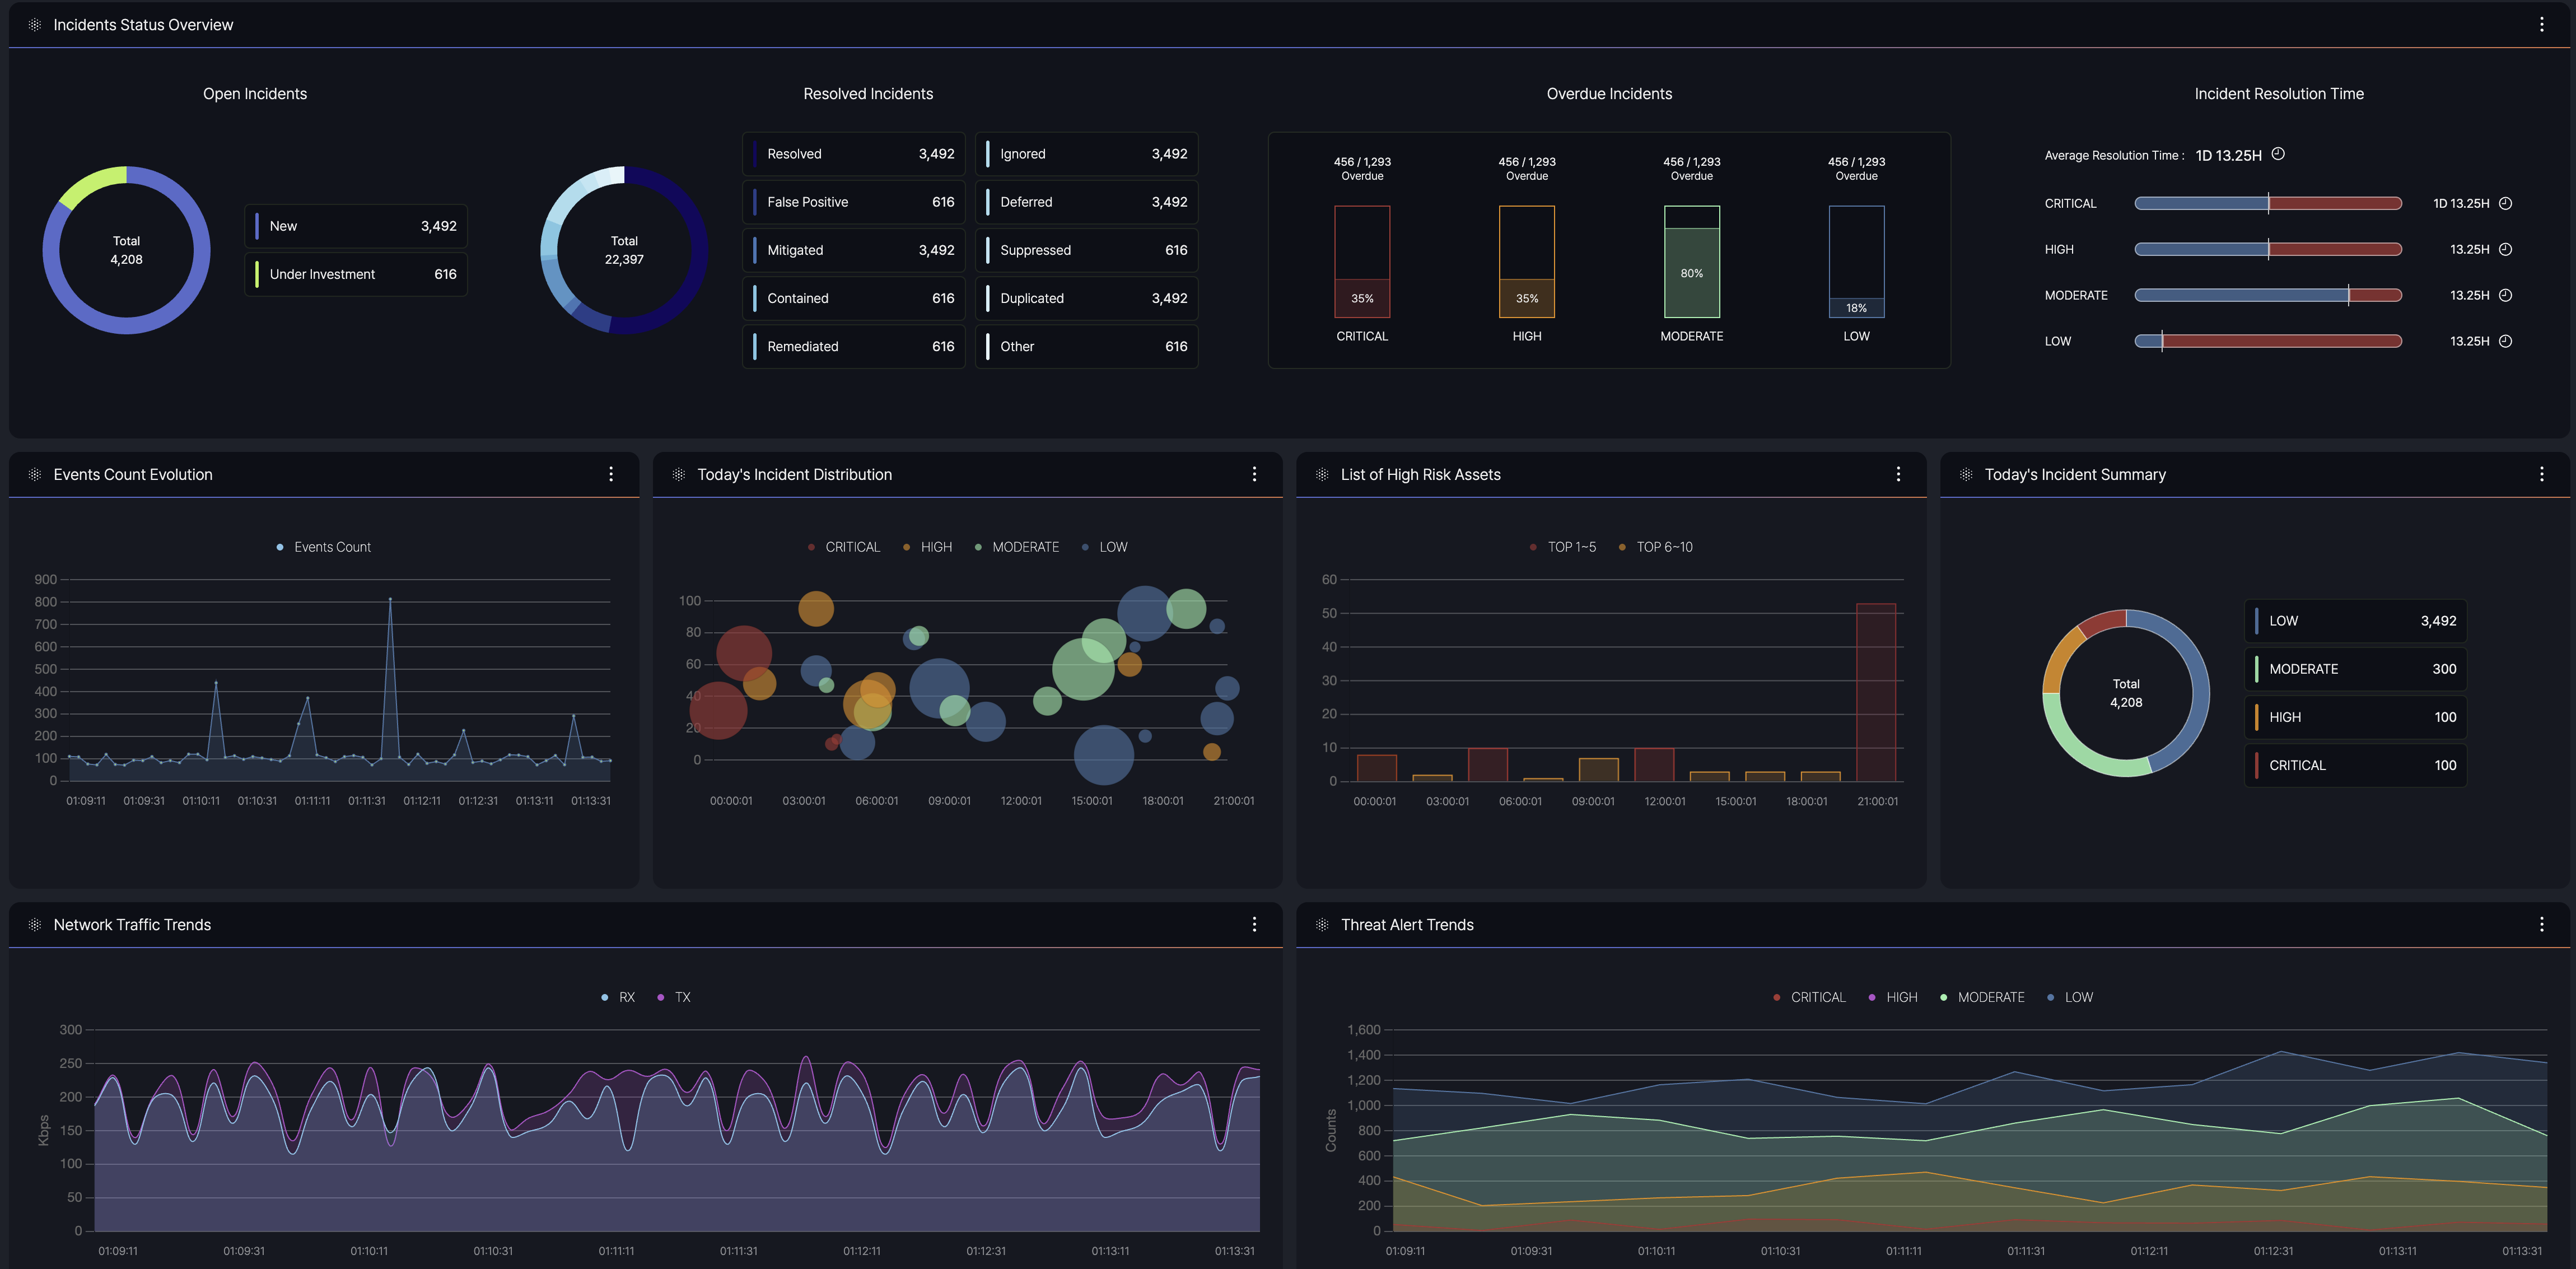
- Purpose: Provides a centralized view of security and network event data, enabling users to monitor and manage incidents effectively.
- Data Sources: Integrates information from multiple origins, including agents, agentless systems, and external feeds.
- Key Information: Displays summaries of event counts, severity levels, and current statuses to facilitate quick decision-making.
Agency Dashboard
- Agency monitoring
- System monitoring

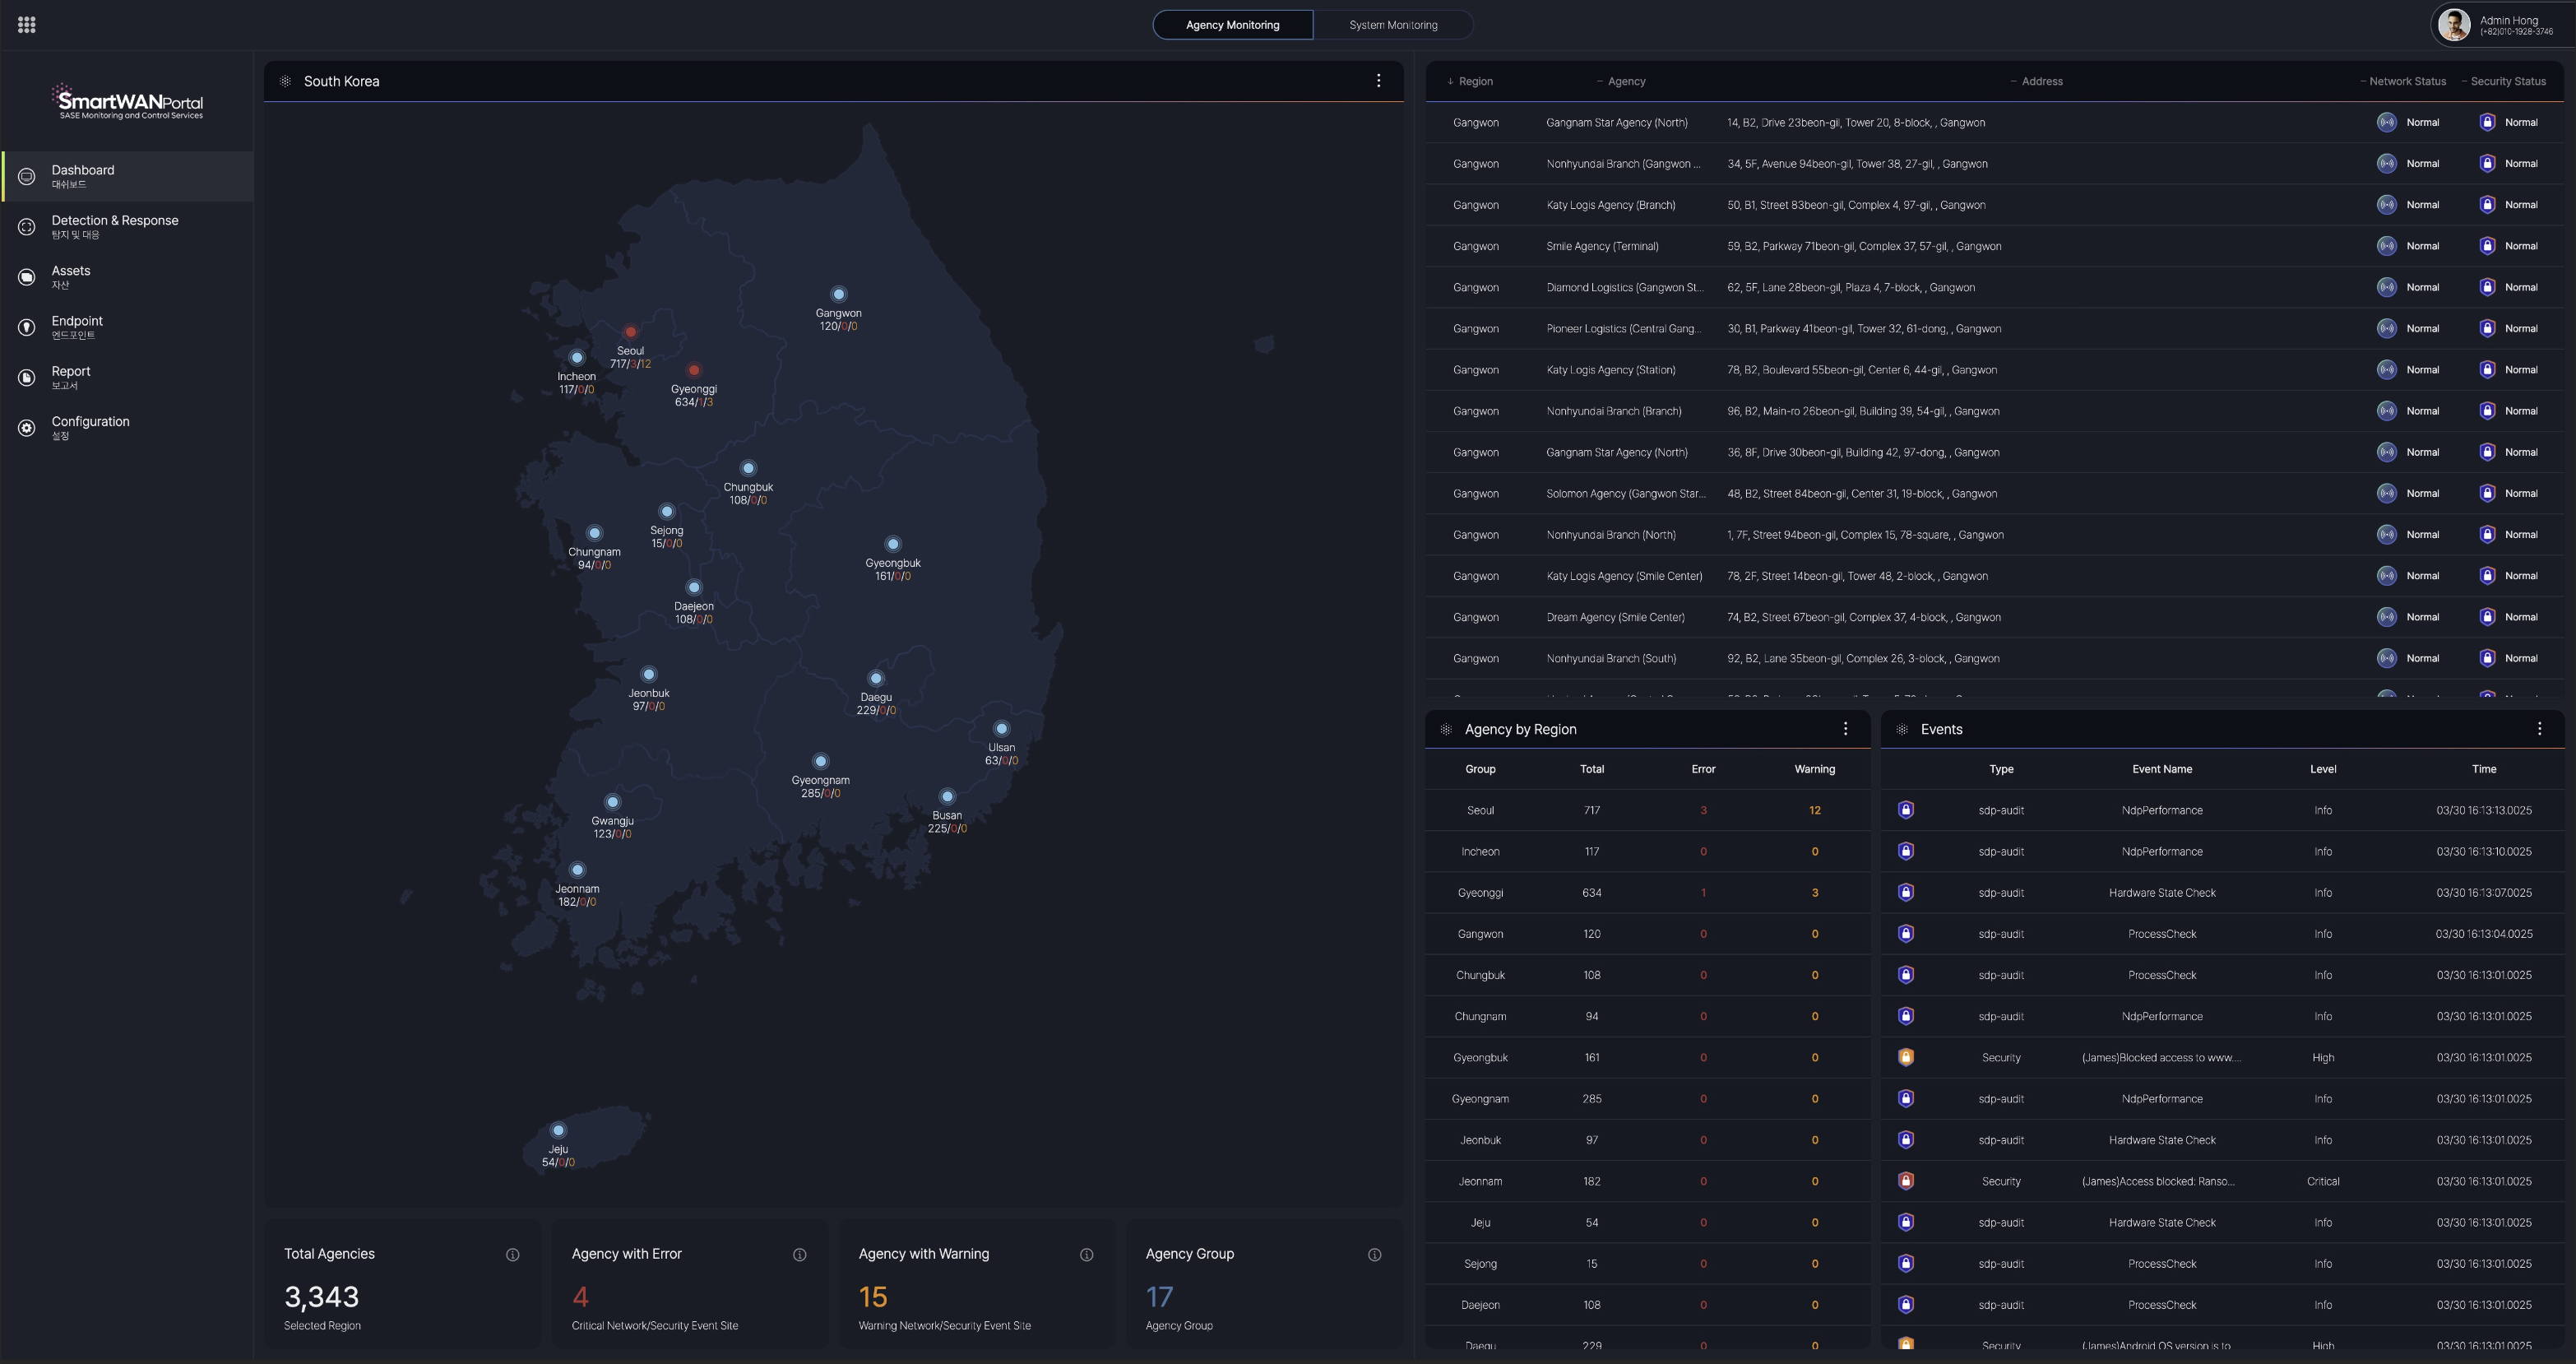
Agency monitoring
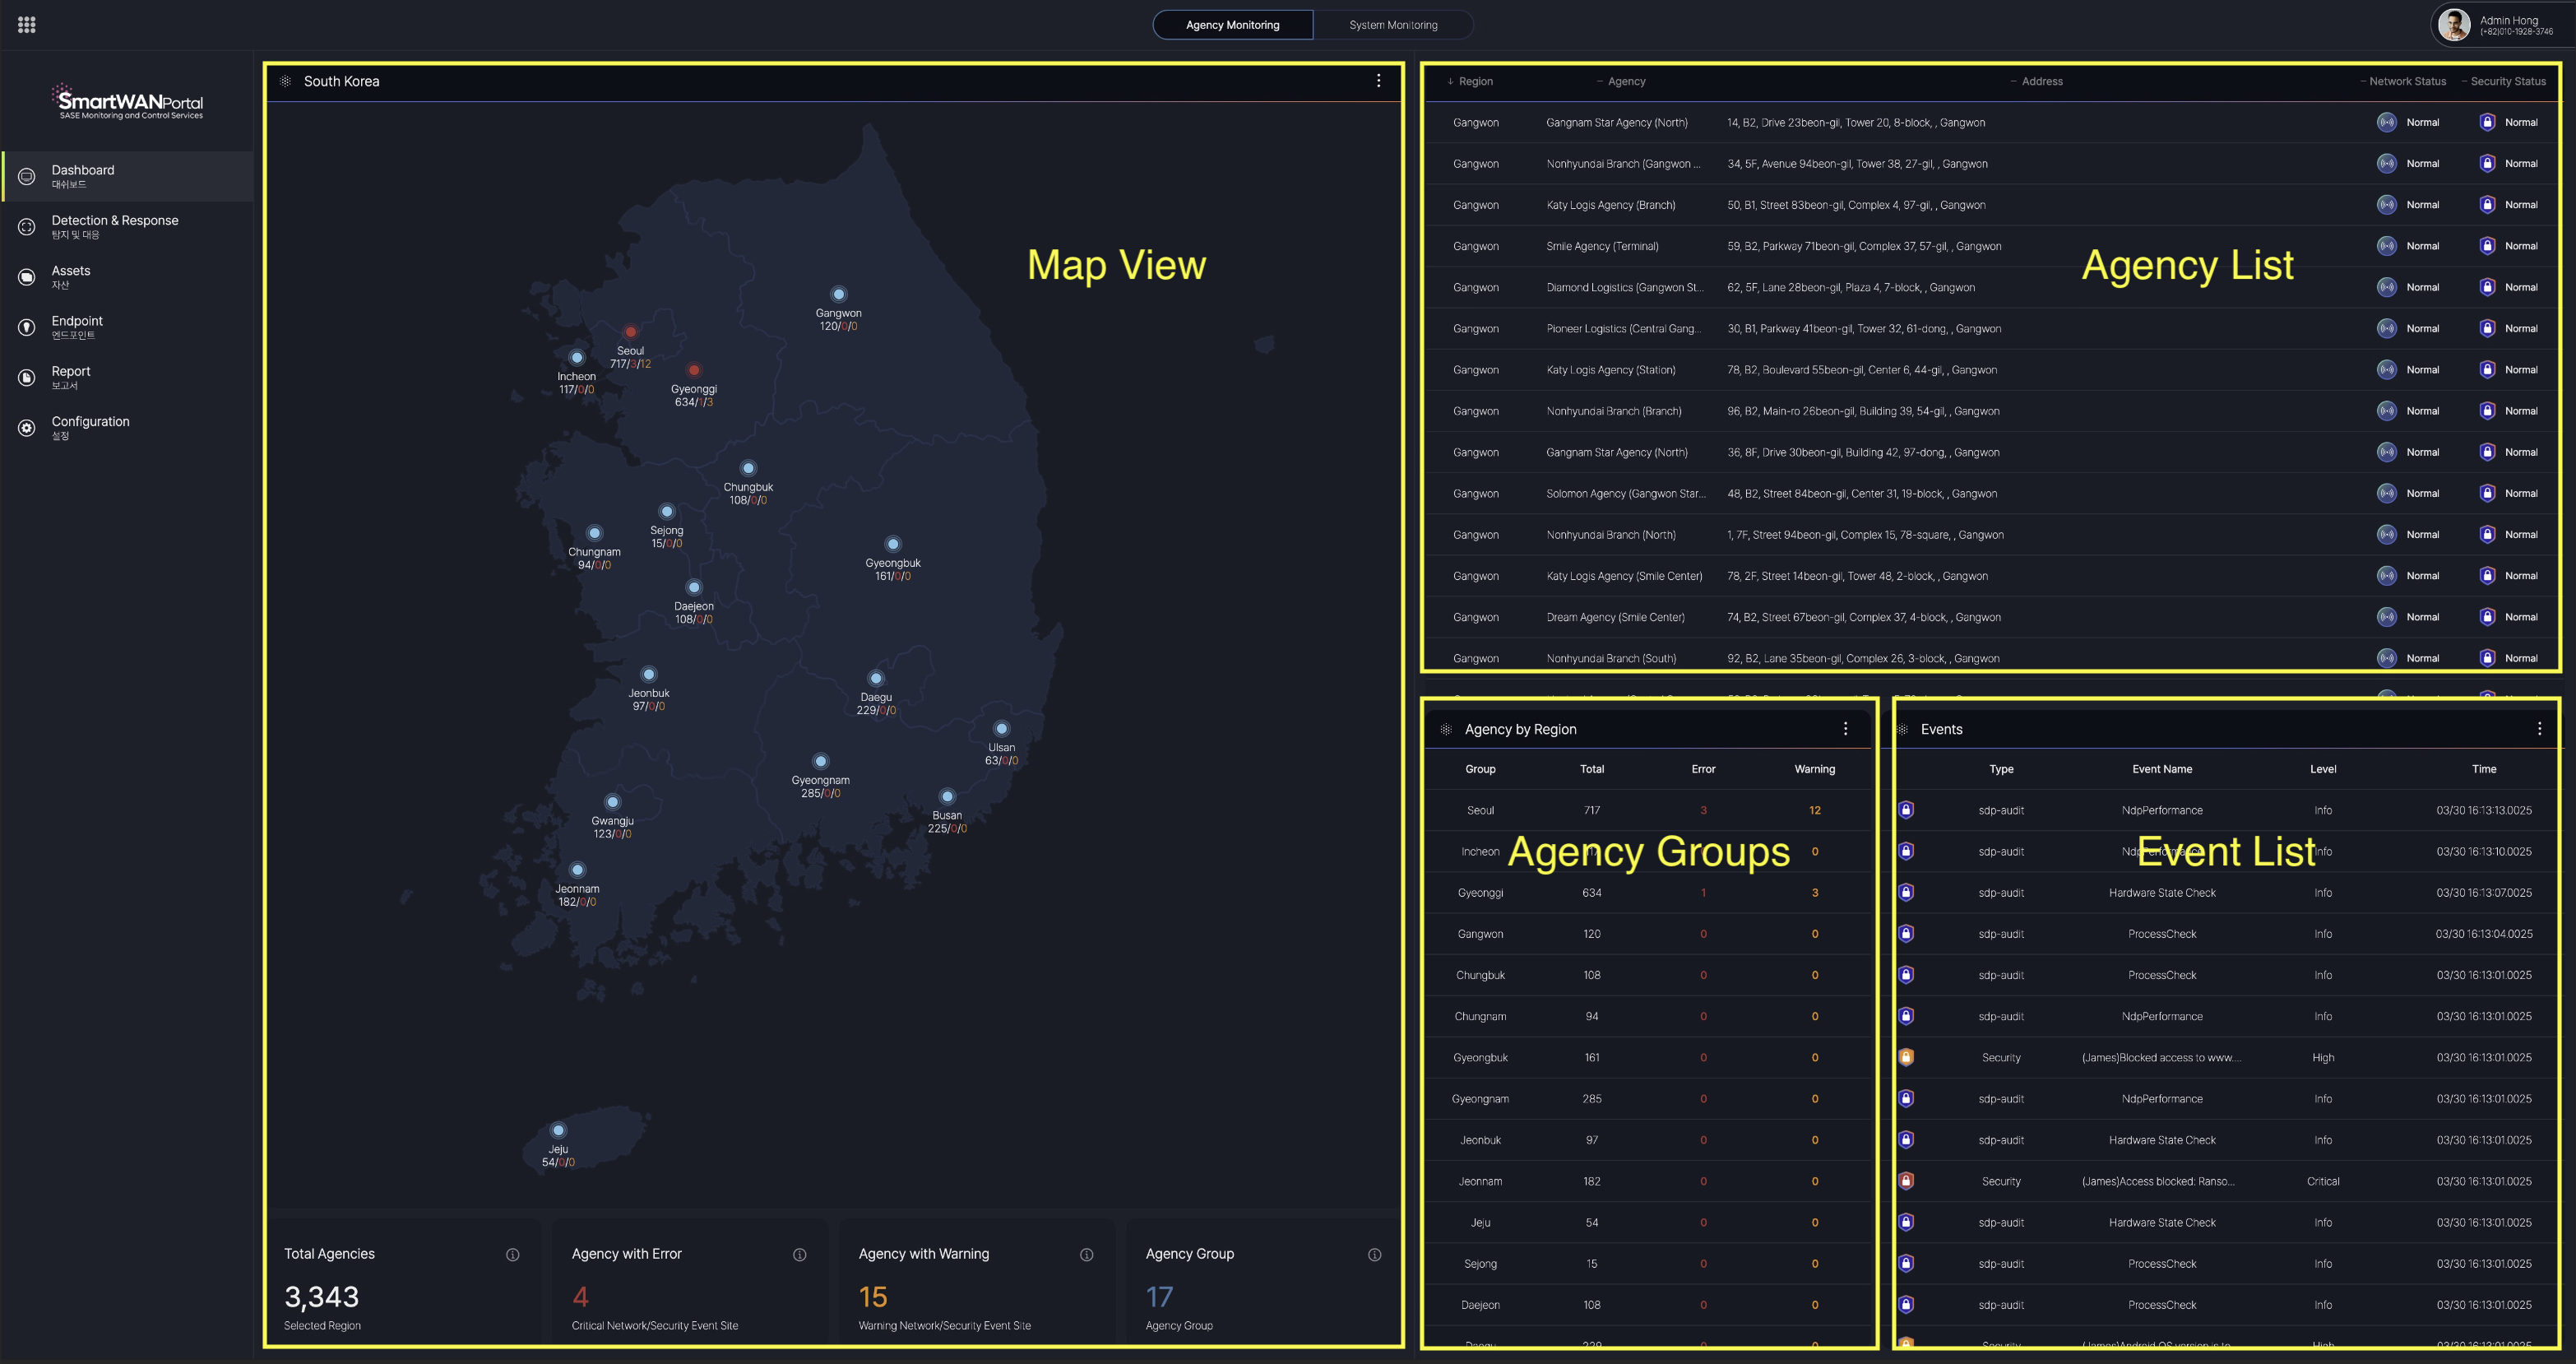
Map View
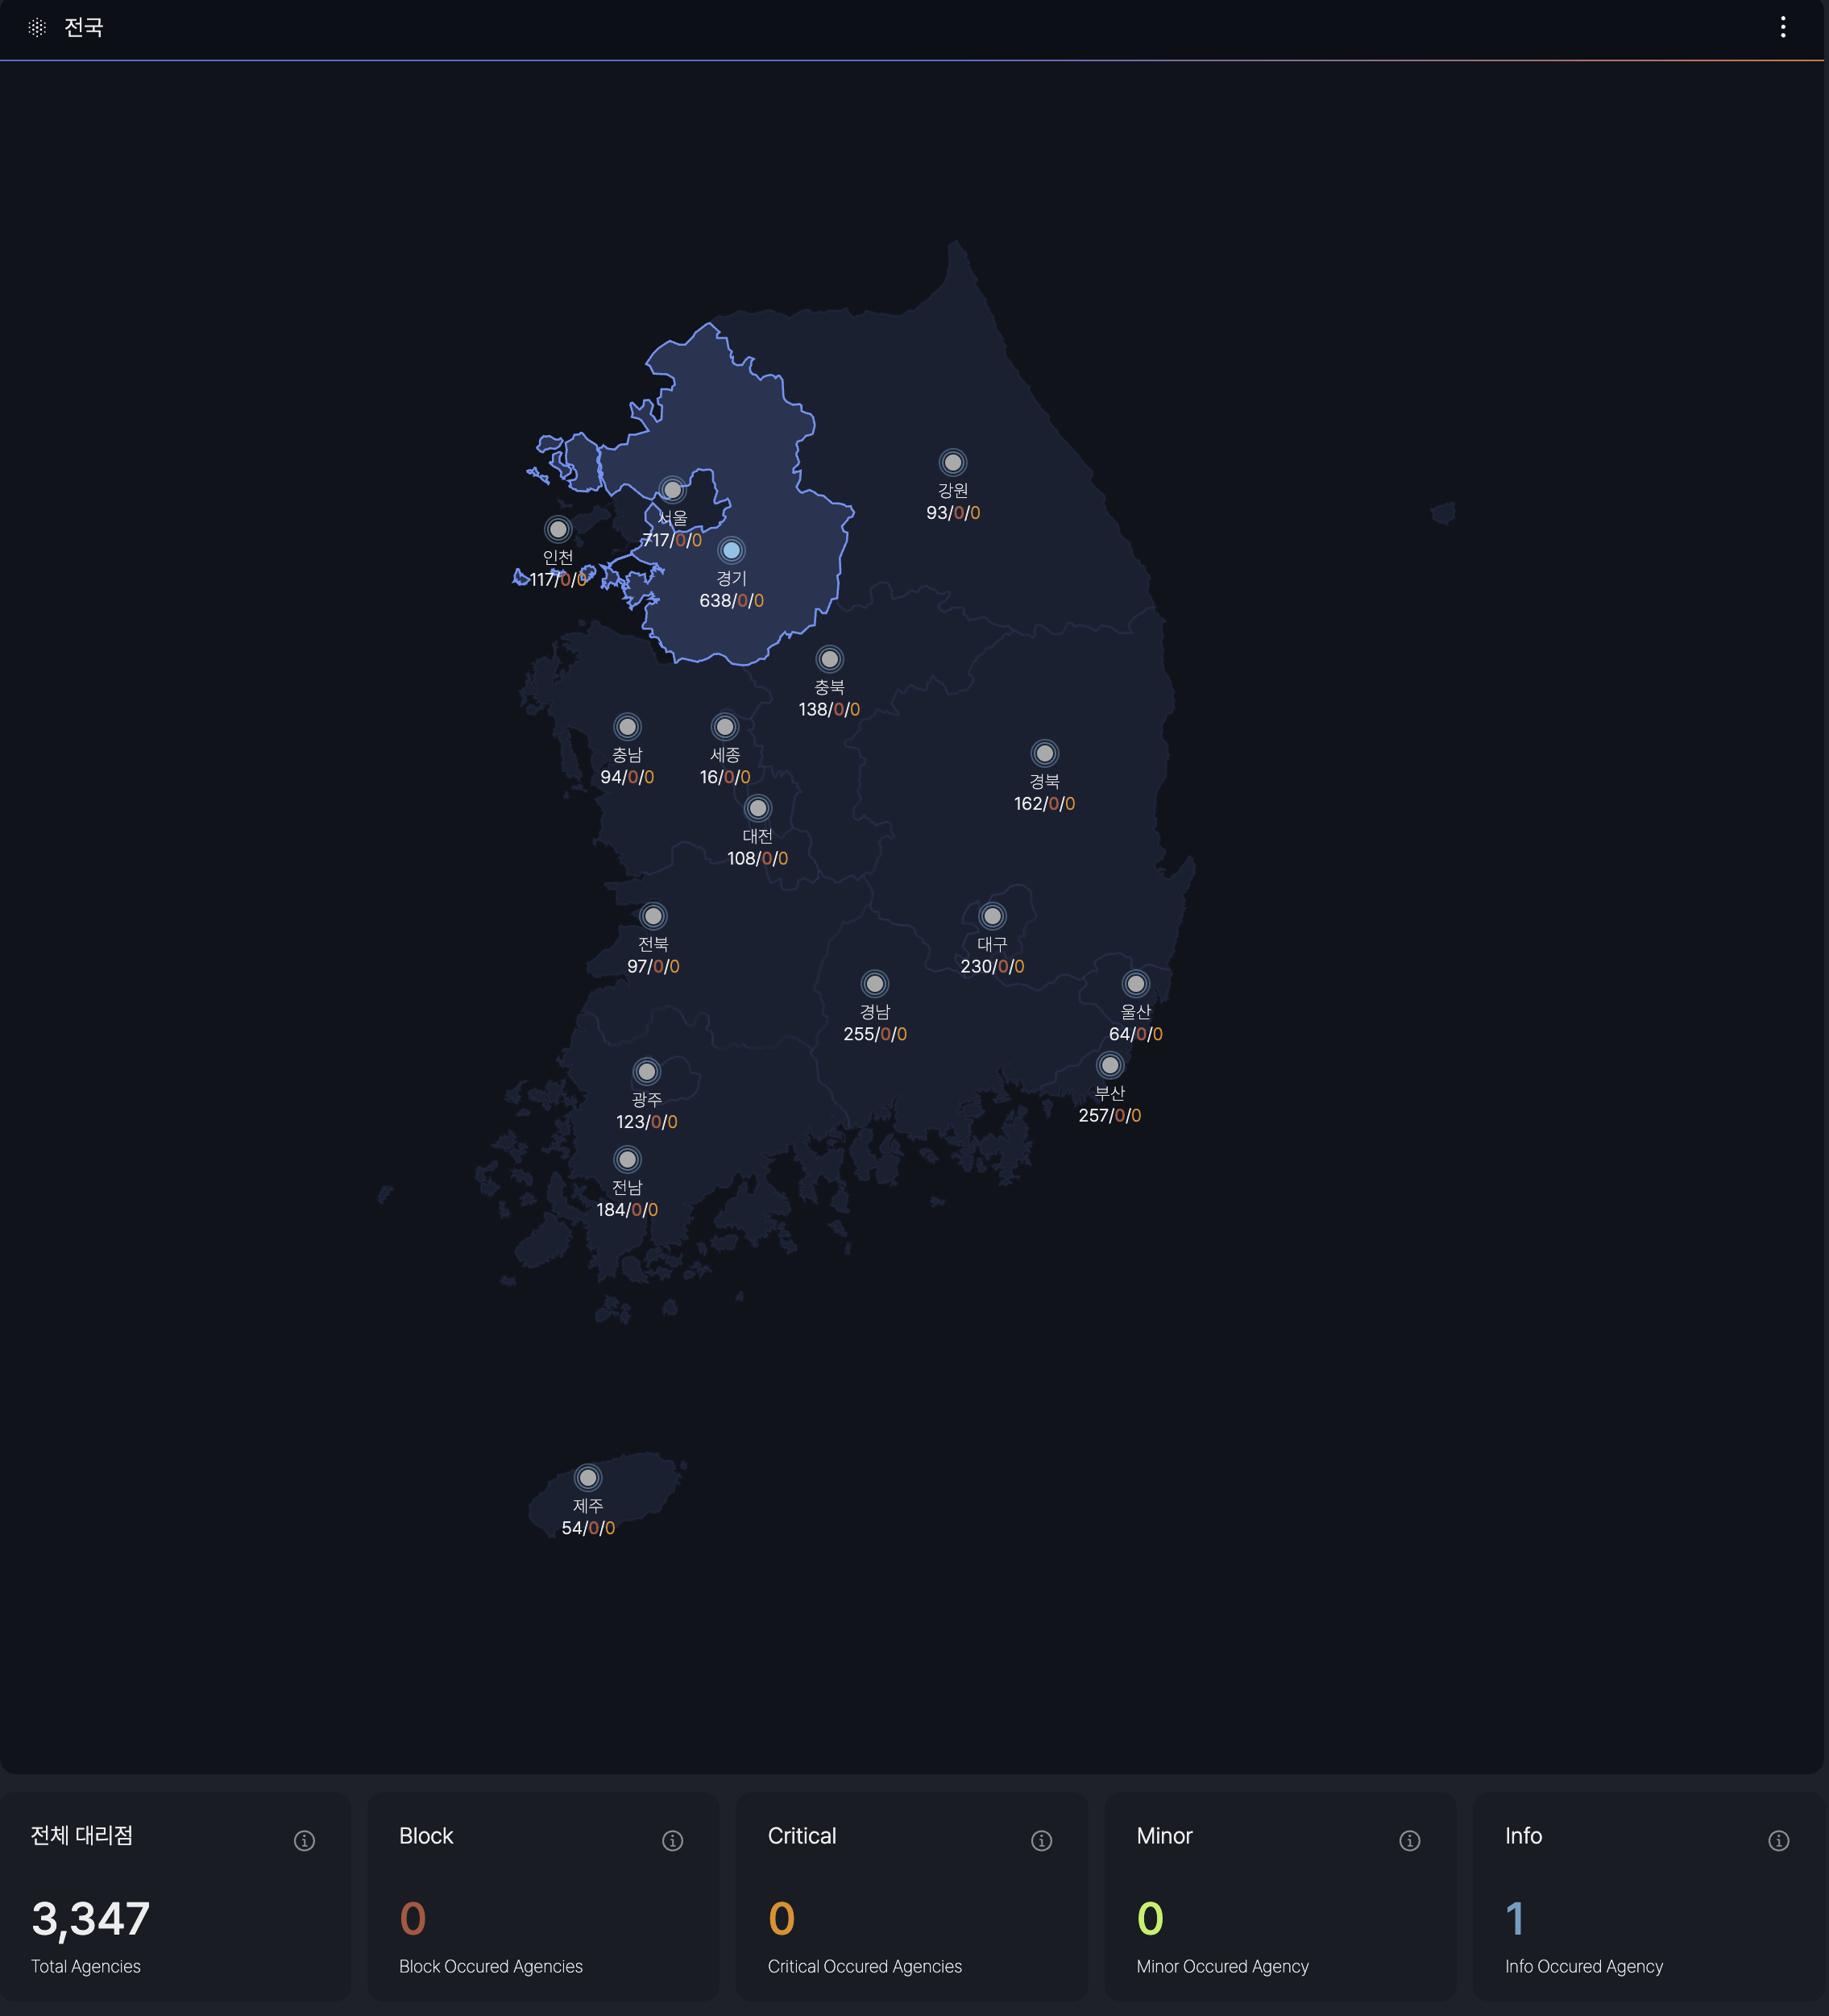
Event levels are defined by SKT's requirements.
Agency List
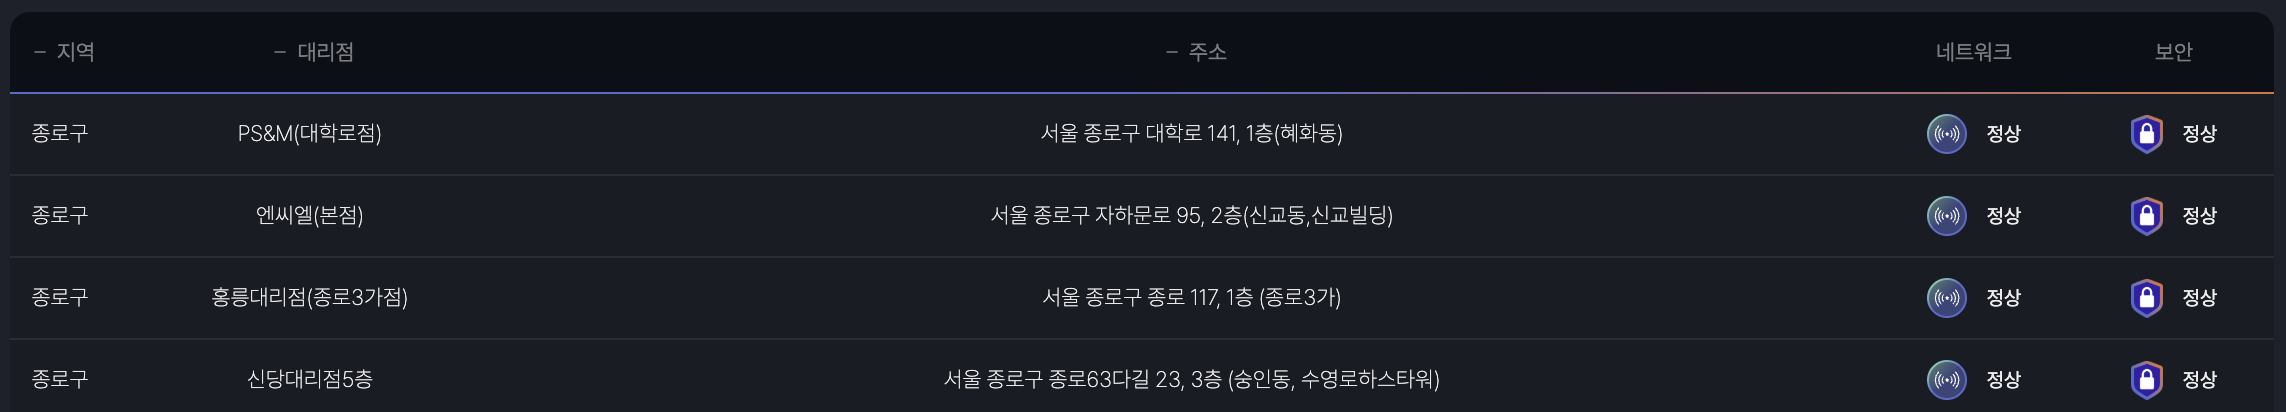
When a specific region is selected in the Map View, the dashboard displays a list of agencies registered in that region, along with detailed information on the Network Status (CPE) and Security Status (SDP) for each agency.
- Agency List: A comprehensive roster of agencies within the selected region.
- Network Status (CPE): Provides the current operational status of the Customer Premises Equipment for each agency.
- Security Status (SDP): Details the security posture, including Software-Defined Perimeter (SDP) metrics, for each agency.
View details of the agency
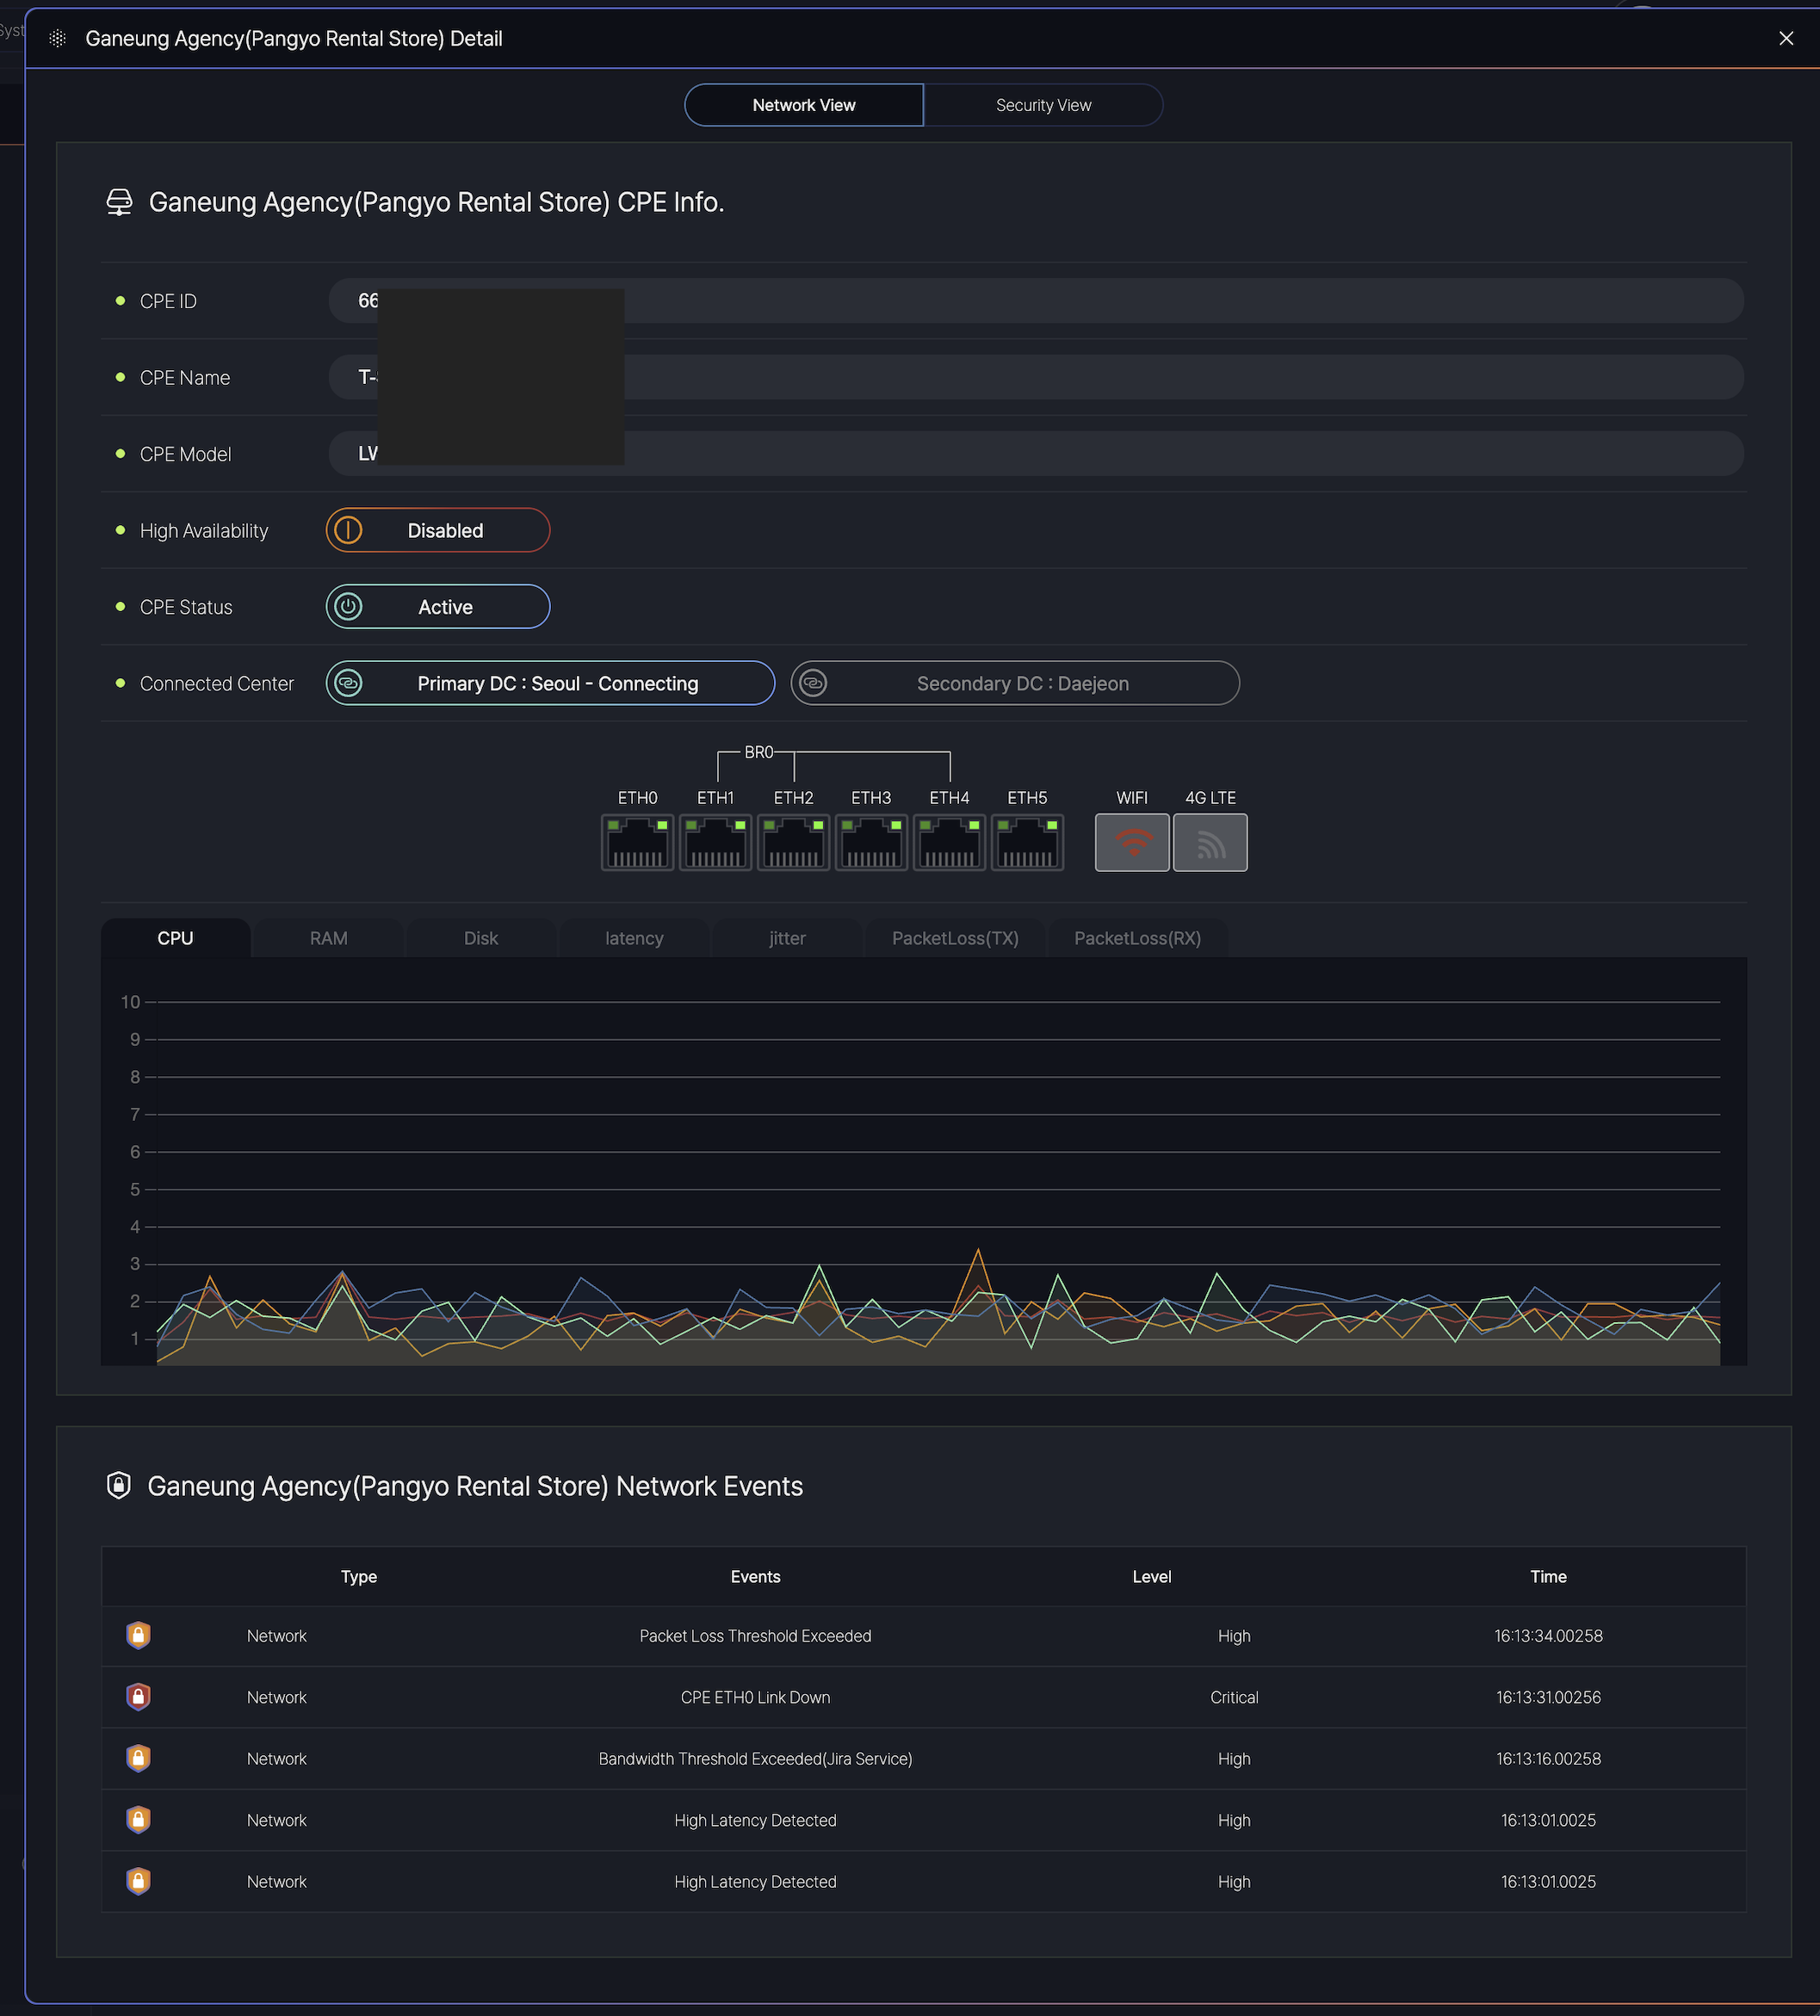
The dashboard is divided into two main tabs:
-
Network View: Displays real-time CPE status and network performance.
-
Security View: Shows security-related alerts and SDP metrics (if applicable).
Displays hardware and connectivity details:
-
CPE ID/Name/Model: Identifies the device.
-
High Availability: Indicates redundancy status ( Enabled / Disabled).
-
CPE Status:
-
Active: Normal operation.
-
Degraded: Performance issues detected.
-
Inactive: Connection lost.
-
-
Connected Data Centers: Primary (Seoul) and Secondary (Daejeon) links.
Network Performance Metrics data(Live) for troubleshooting:
-
CPU/RAM/Disk: Resource usage (% or GB).
-
Latency/Jitter: Measured in milliseconds (ms).
-
Packet Loss (TX/RX): Percentage of lost data packets.
Lists recent events with types and levels:
| Column | Description | Example |
|---|---|---|
| Type | Event category (Network/Security). | Network |
| Event | Description of the issue. | CPE ETH0 Link Down |
| Level | Severity: Info, High, Critical. |
Critical |
| Time | Timestamp (HH:MM:SS.milliseconds). | 16:13:31.00256 |
Agency Groups
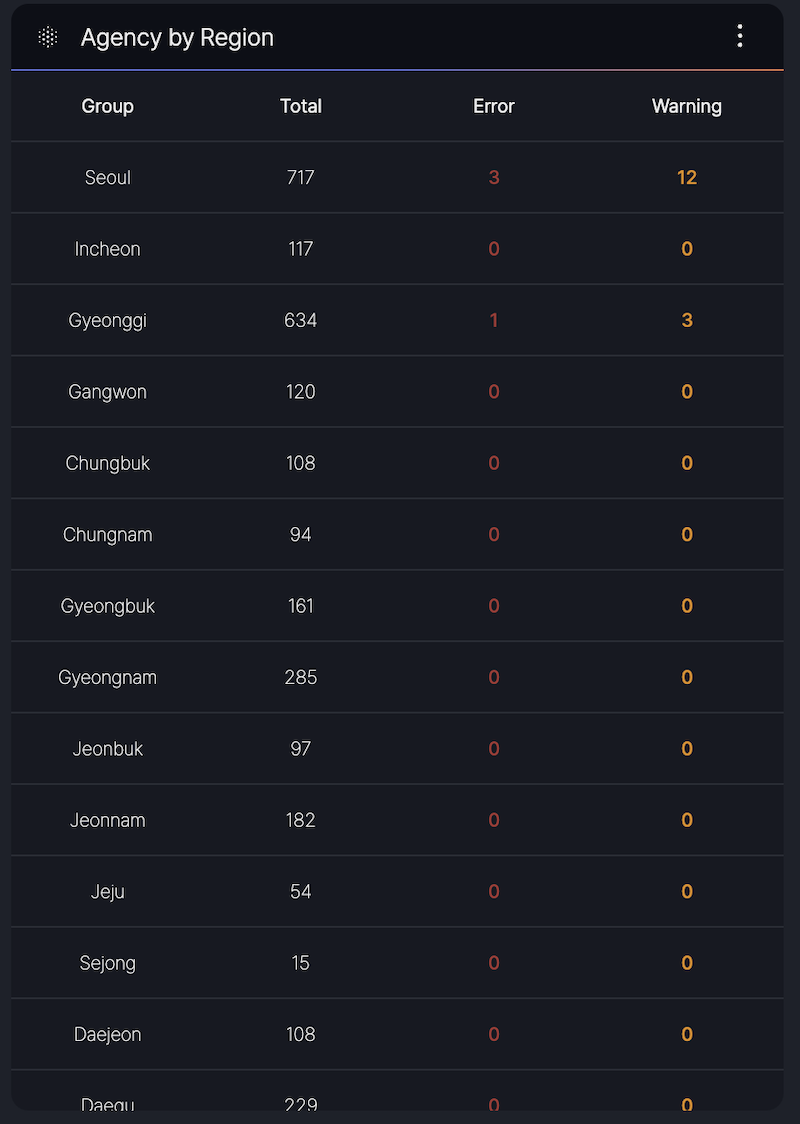
The Agency Group section provides a summary of agency counts per region and detailed status information for CPE.
- Region-Based Counts: Displays the total number of agencies in each region.
- CPE Status Info: Offers insights into the operational status of CPE devices across the agencies
Event List
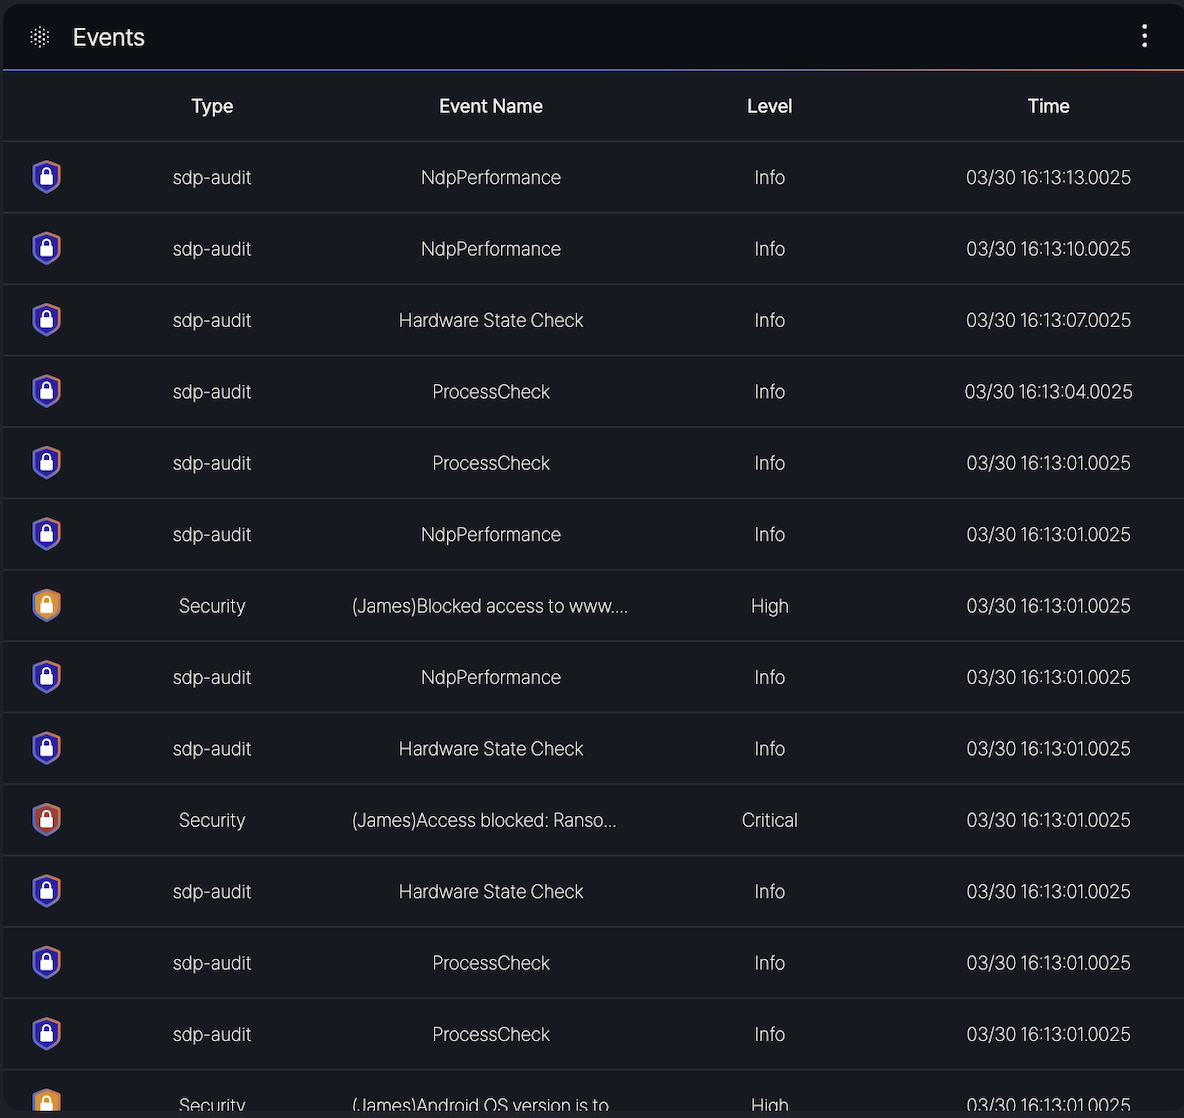
- Type: Indicates the category of the event (e.g., sdp-audit, Security).
- Event Name: Specifies the event description (e.g., NdpPerformance, Hardware State Check, ProcessCheck, or security-related messages like [JAMES] Blocked access to www…).
- Level: Denotes the severity of the event, categorized as Info, Minor, or Critical, Block.
- Time: Shows the timestamp of the event in the format MM/DD HH:MM:SS.milliseconds (e.g., 03/30 16:13:00.025).
- sdp-audit events such as NdpPerformance and Hardware State Check with Info level.
- Security events like [JAMES] Access blocked: Rans… with Critical level or [JAMES] Android OS version is to… with High level.