Home Screen
Some features described below are currently in the prototype stage and are scheduled for future implementation.
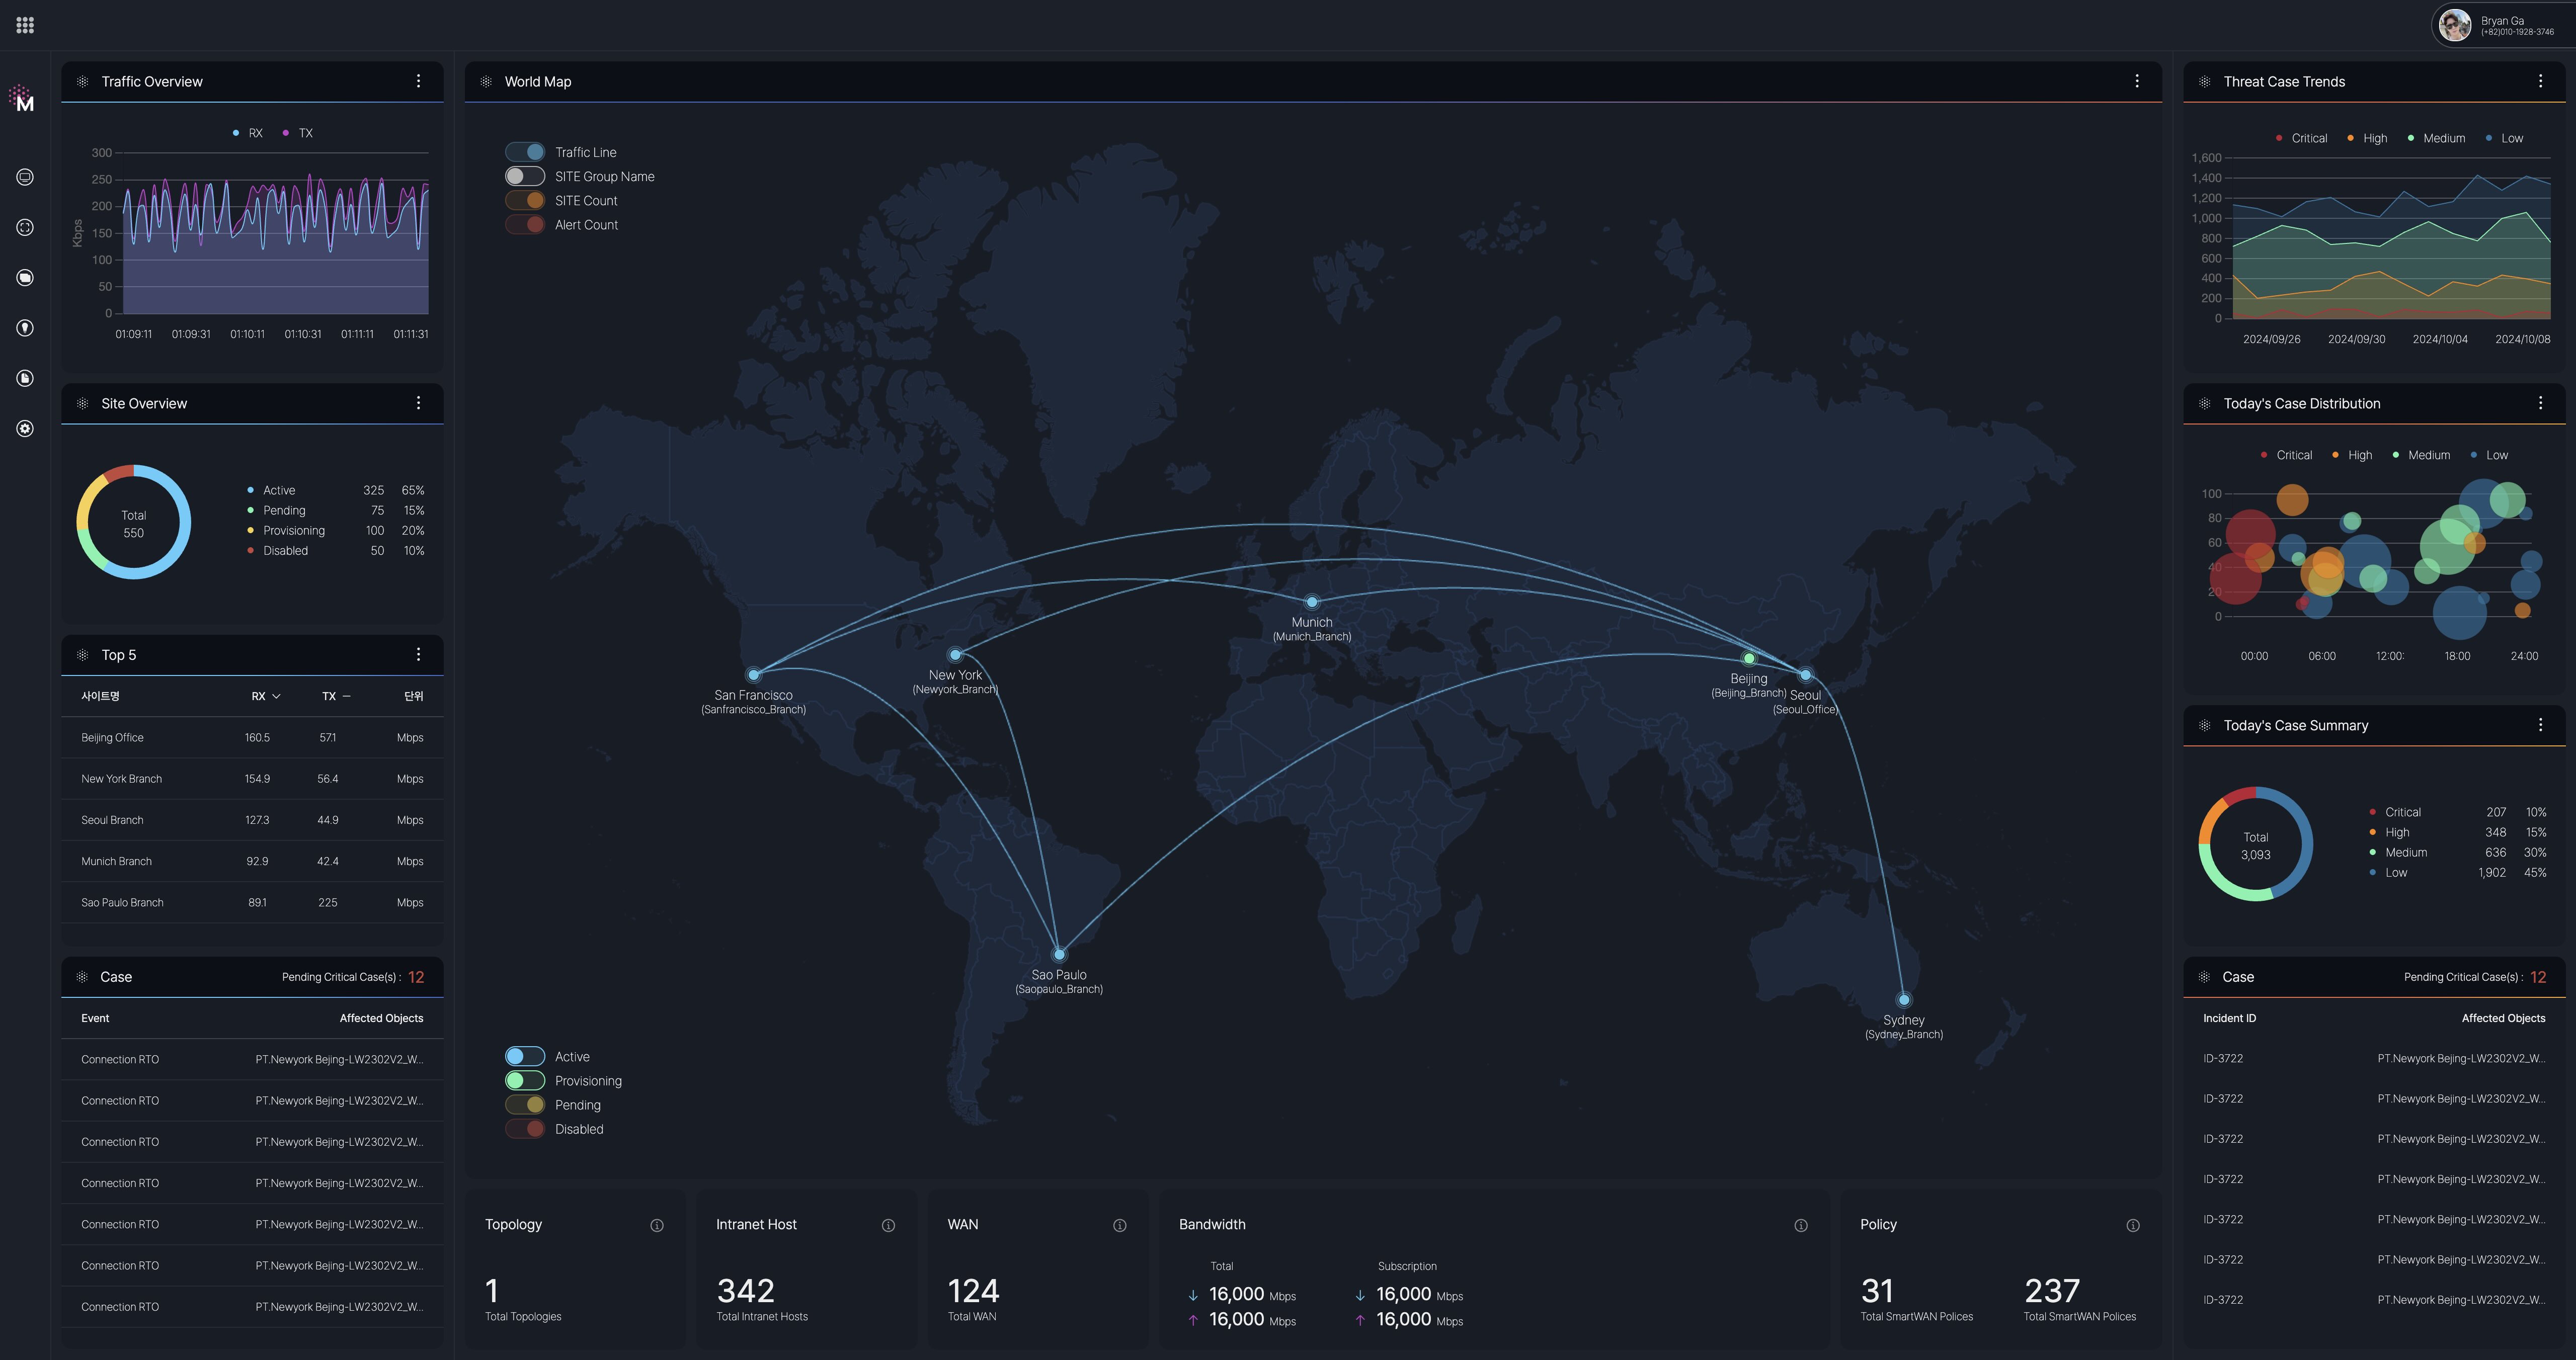
Upon logging in to the SmartWAN Portal, the Home Screen automatically appears, providing a comprehensive overview of network and security events across locations worldwide.
Widgets
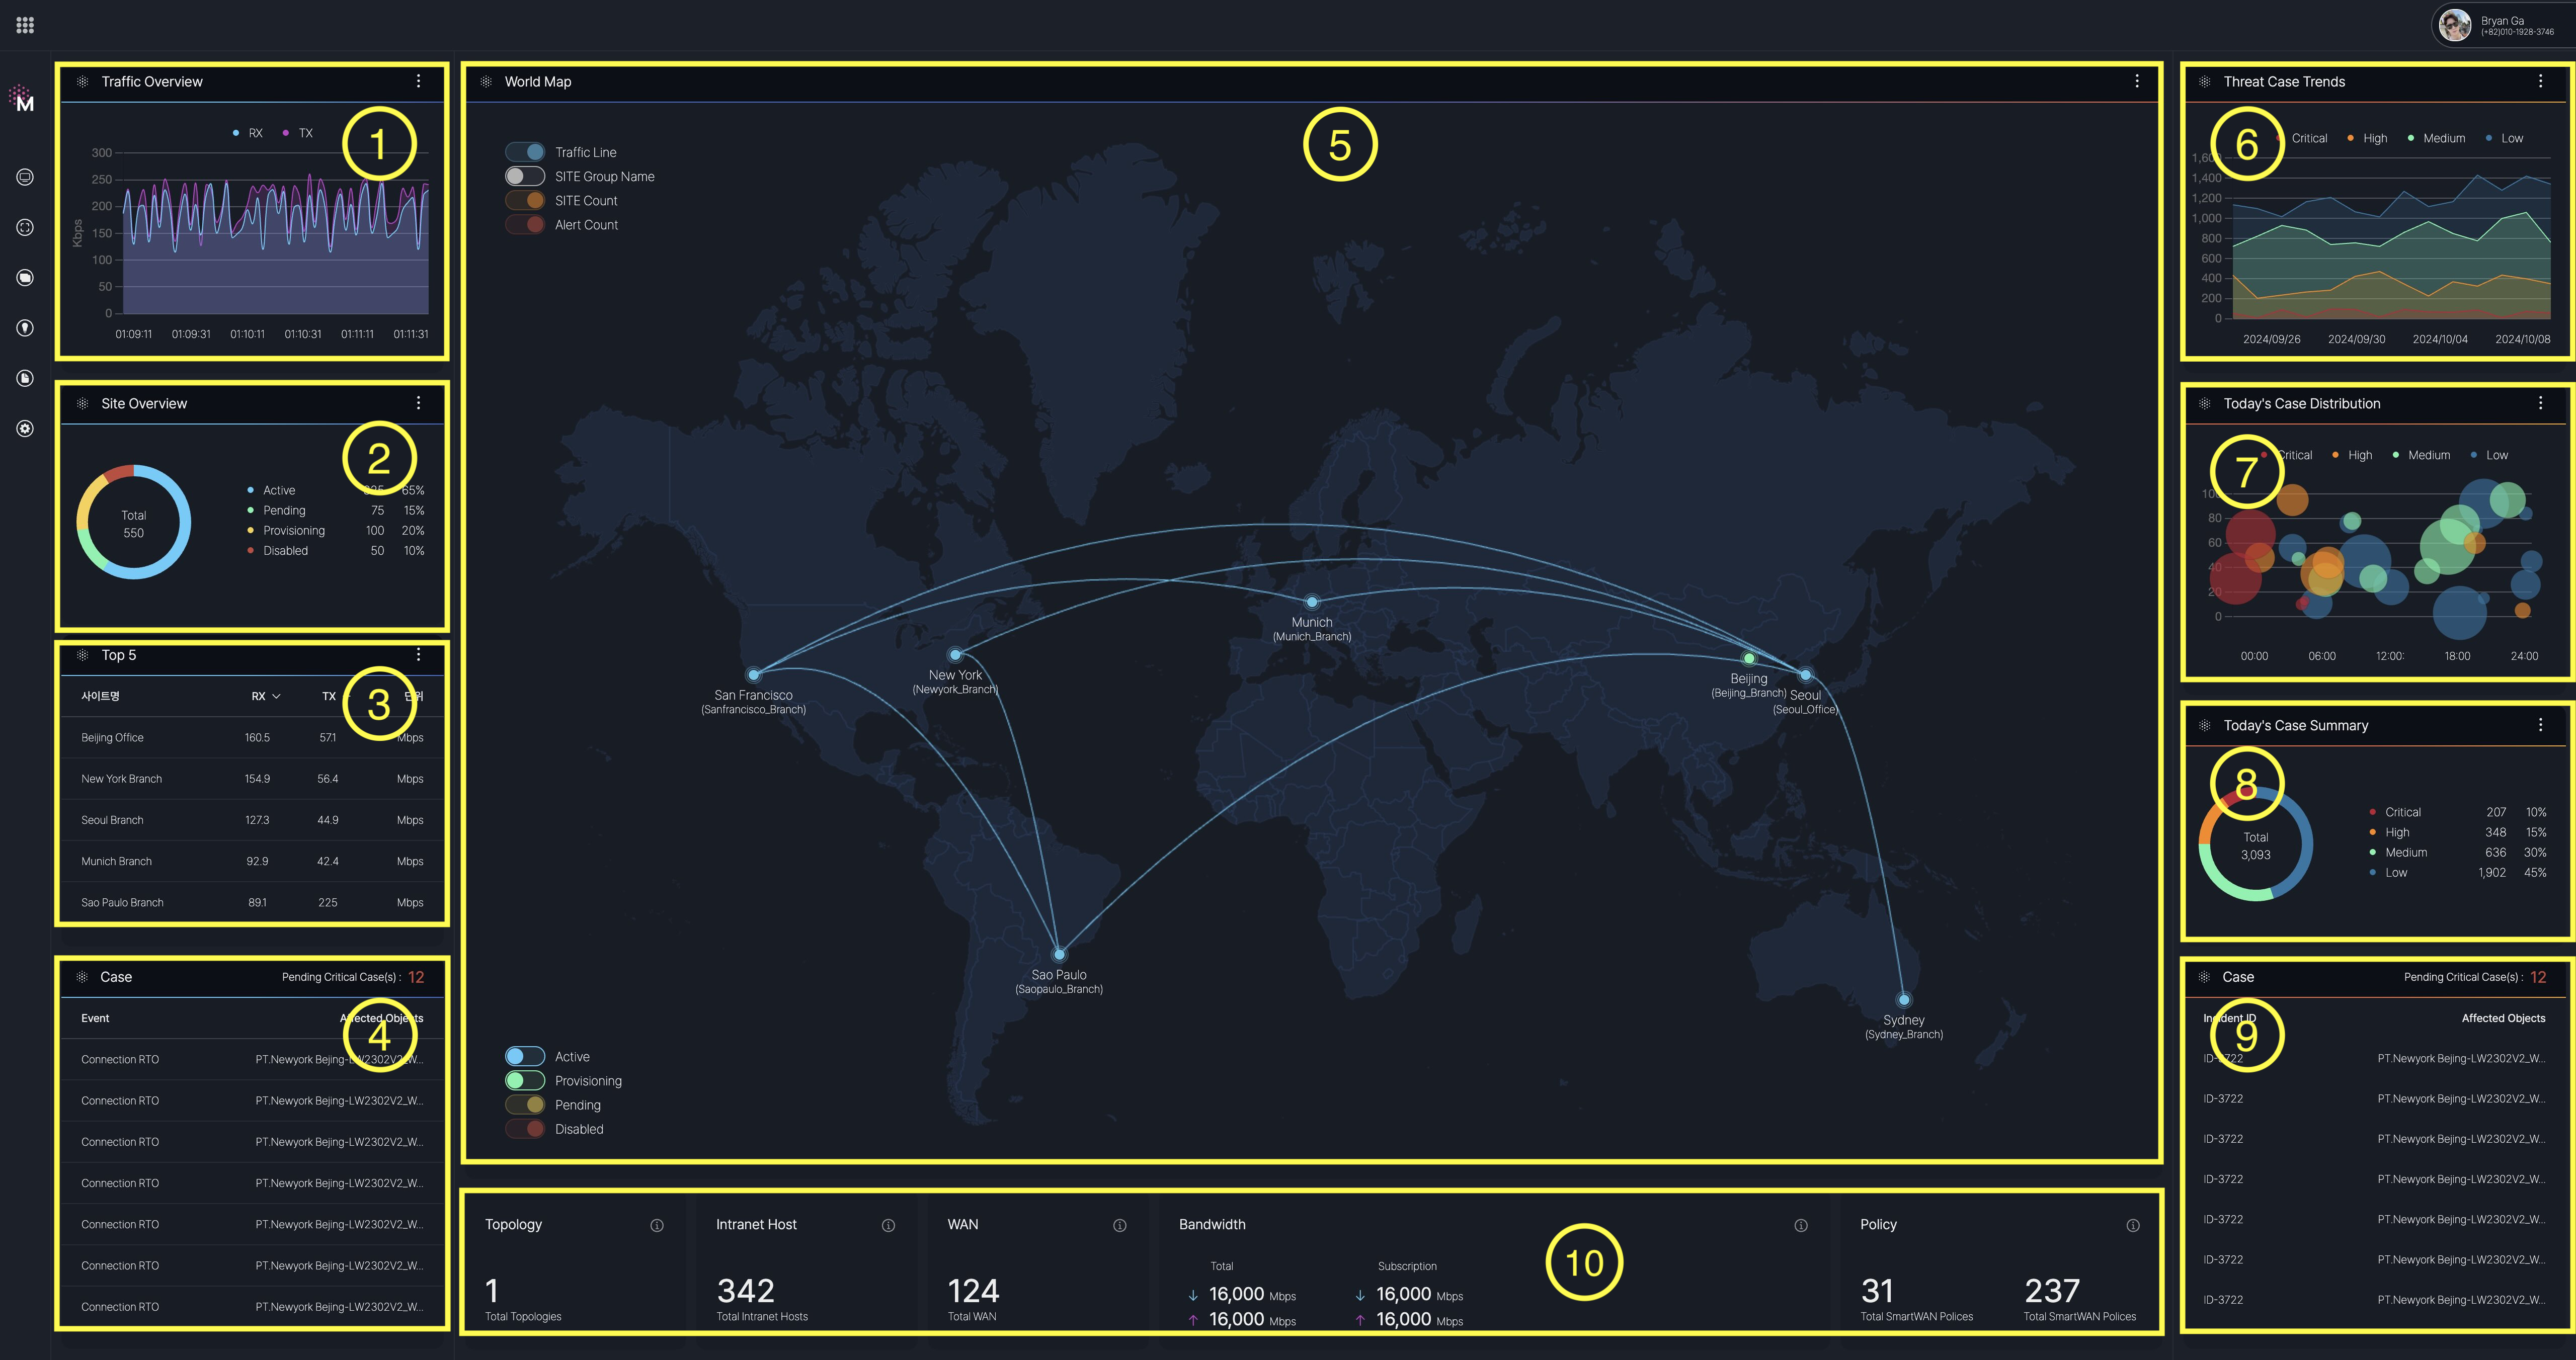
1. Traffic Widget
- Description: Displays real-time network traffic data over a selected time period (e.g., last 24 hours). The graph shows RX (receive) and TX (transmit) traffic in Mbps, with peaks and trends.
2. Site Overview
- Description: Shows a summary of the status sites.
3. Top5
- Description: Displays the top 5 sites ranked by network traffic
4. Case
- Description: Lists critical cases and their affected objects, and provides on pending critical cases
5. World Map(Map view)
- Description: Provides a global map view of locations, with lines indicating connectivity between sites (e.g., Munich, New York, San Francisco, Sao Paulo, Sydney).
6. Threat case trends
- Description: A line graph showing trends in threat cases over time. Categories include Critical, High, Medium, and Low, with data points indicating case counts.
7. Today's Case Distribution
- Description: A scatter plot visualizing the distribution of cases by severity (Critical, High, Medium, Low) over a 24-hour period. Each bubble represents a case, with size indicating the number of incidents (e.g., Critical: 207 cases).
8. Today's Case Summary
- Description: A pie chart summarizing the total cases for the day.
9. Case
- Description: A table shows that case-affected objects.
10. Network Summary Metrics
-
Topology:
- Total Topologies: Displays the total number of network topologies (e.g., 1).
- Total Intranet Hosts: Shows the total number of intranet hosts connected (e.g., 342).
- Total WAN: Indicates the total number of Wide Area Network (WAN) connections (e.g., 124).
- Total Bandwidth: Displays the total bandwidth capacity for both download (↓) and upload (↑) in Mbps (e.g., 16,000 Mbps for both).
- Subscription Bandwidth: Shows the subscribed bandwidth for both download (↓) and upload (↑) in Mbps (e.g., 16,000 Mbps for both).
- Total SmartWAN Policies: Lists the total number of SmartWAN policies in place (e.g., 31).
- Total SmartWAN Policies (Subscription): Indicates the number of subscribed SmartWAN policies (e.g., 237).
The widgets provided on the dashboard may be modified in the future based on evolving requirements.
Map Submenu
After logging in to the SmartWAN Portal, the Home screen displays the world map by default, featuring a world map in the "Map View." On the right side of the map, users can access additional options through the Map Submenu.
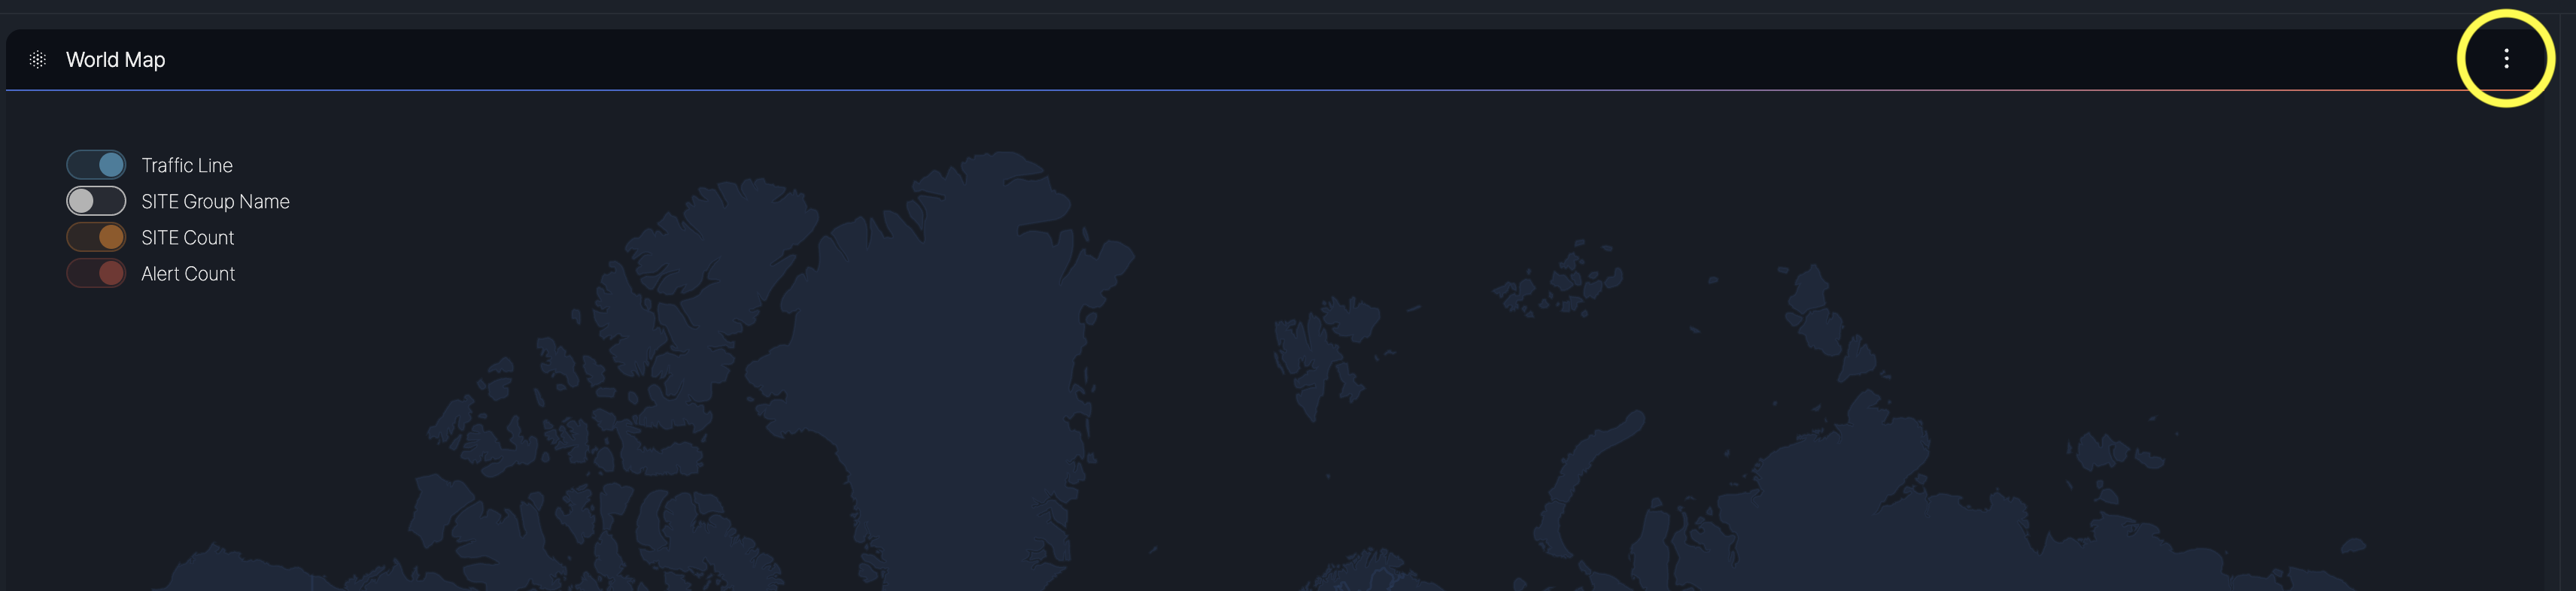
Click the vertical "⋮" (three dots) icon to open the Map Sub Menu. This menu allows users to filter and view site information based on specific criteria
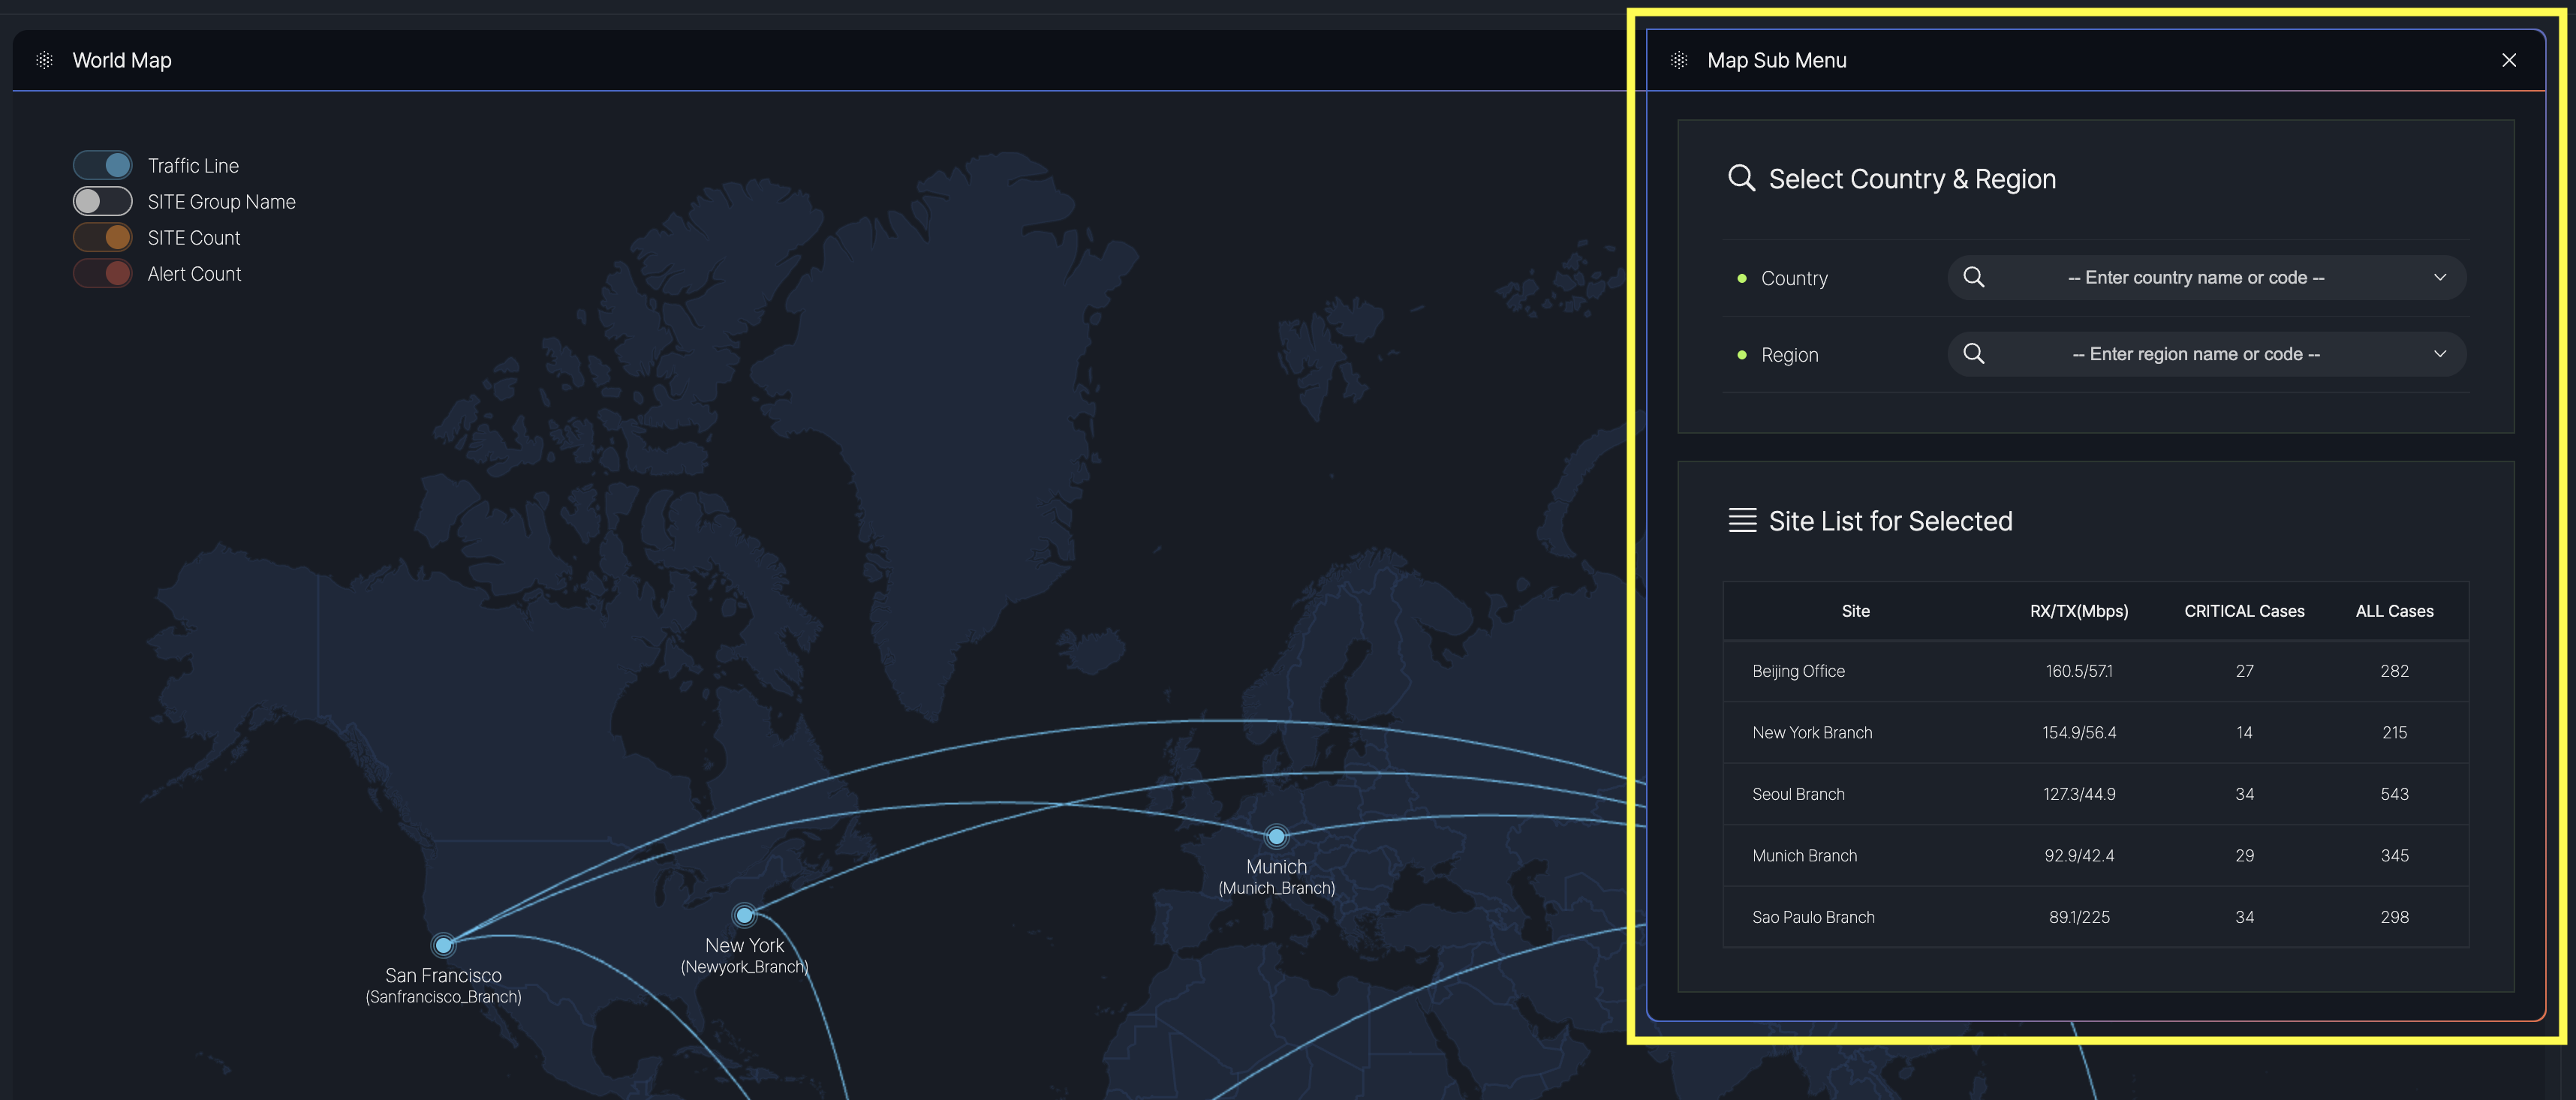
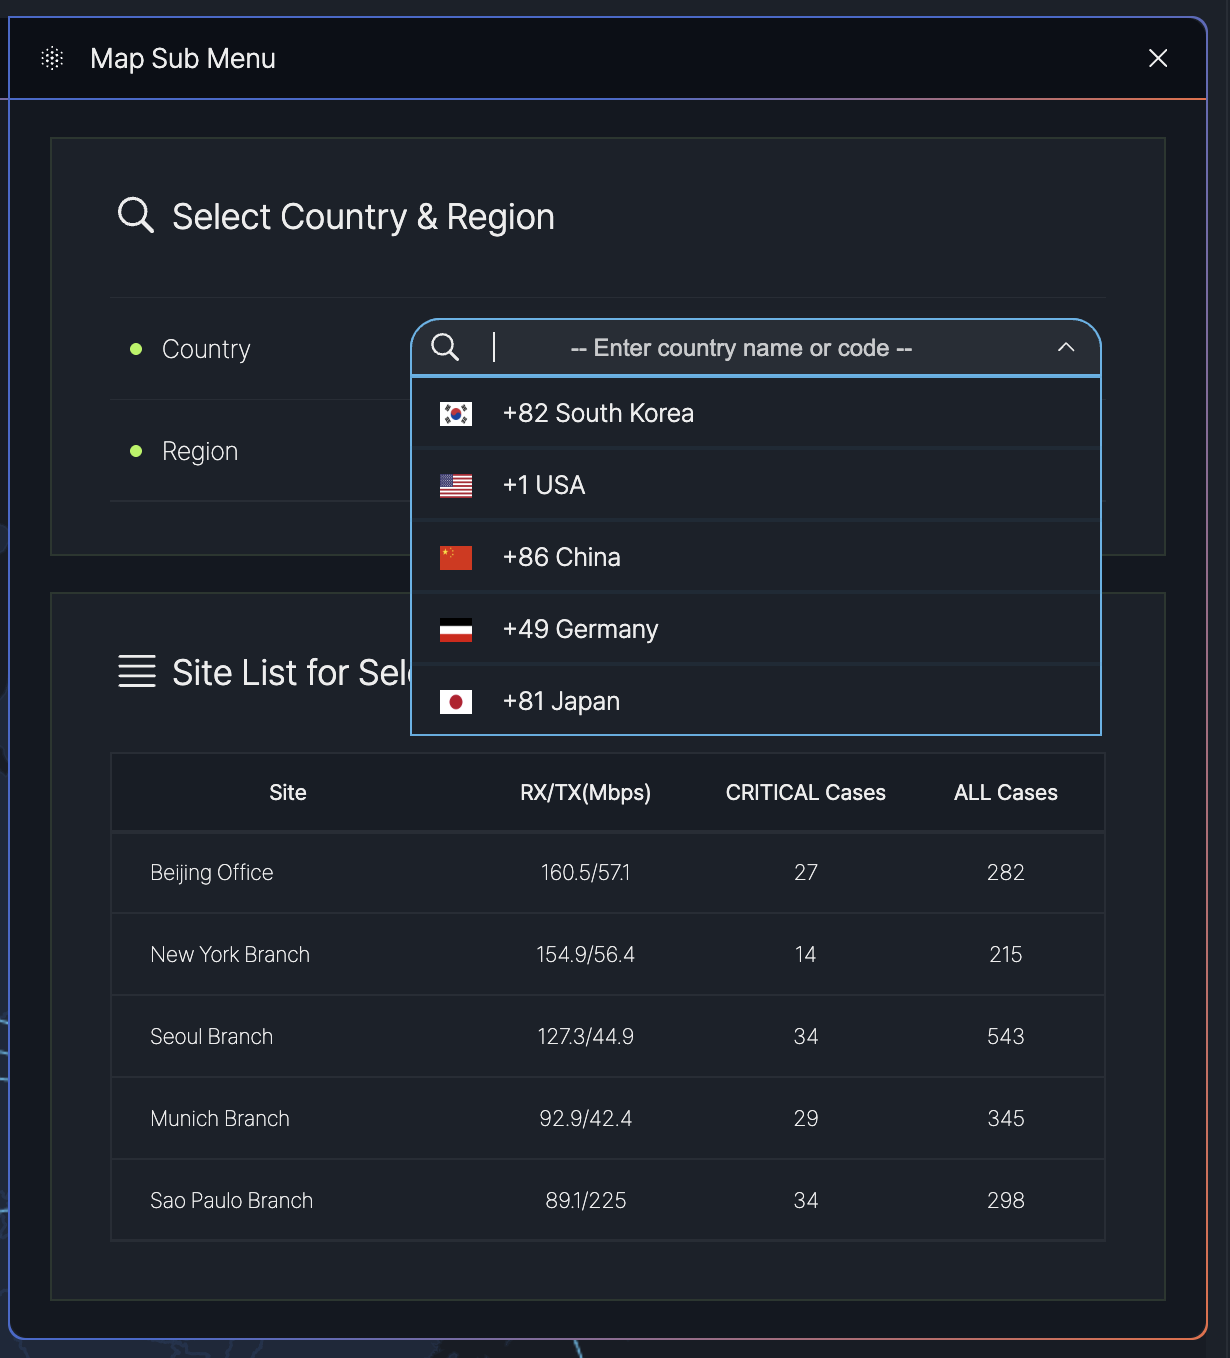
Filtering Sites by Country and Region
- Select Country & Region:
- Country: A dropdown menu to select a country (e.g., South Korea, USA, China, Germany, Japan).
- Region: A dropdown menu to select a region within the chosen country (e.g., USA > California).
- Site List:
- After applying the country and region filters, a list of sites within the selected area is displayed.
- The list includes columns such as:
- Site: Name of the site (e.g., Head Office, New York Branch).
- RX/TX (Mbps): Network traffic data for receive (RX) and transmit (TX) in Mbps.
- Critical Cases: Number of critical cases associated with the site.
- All Cases: Total number of cases for the site.
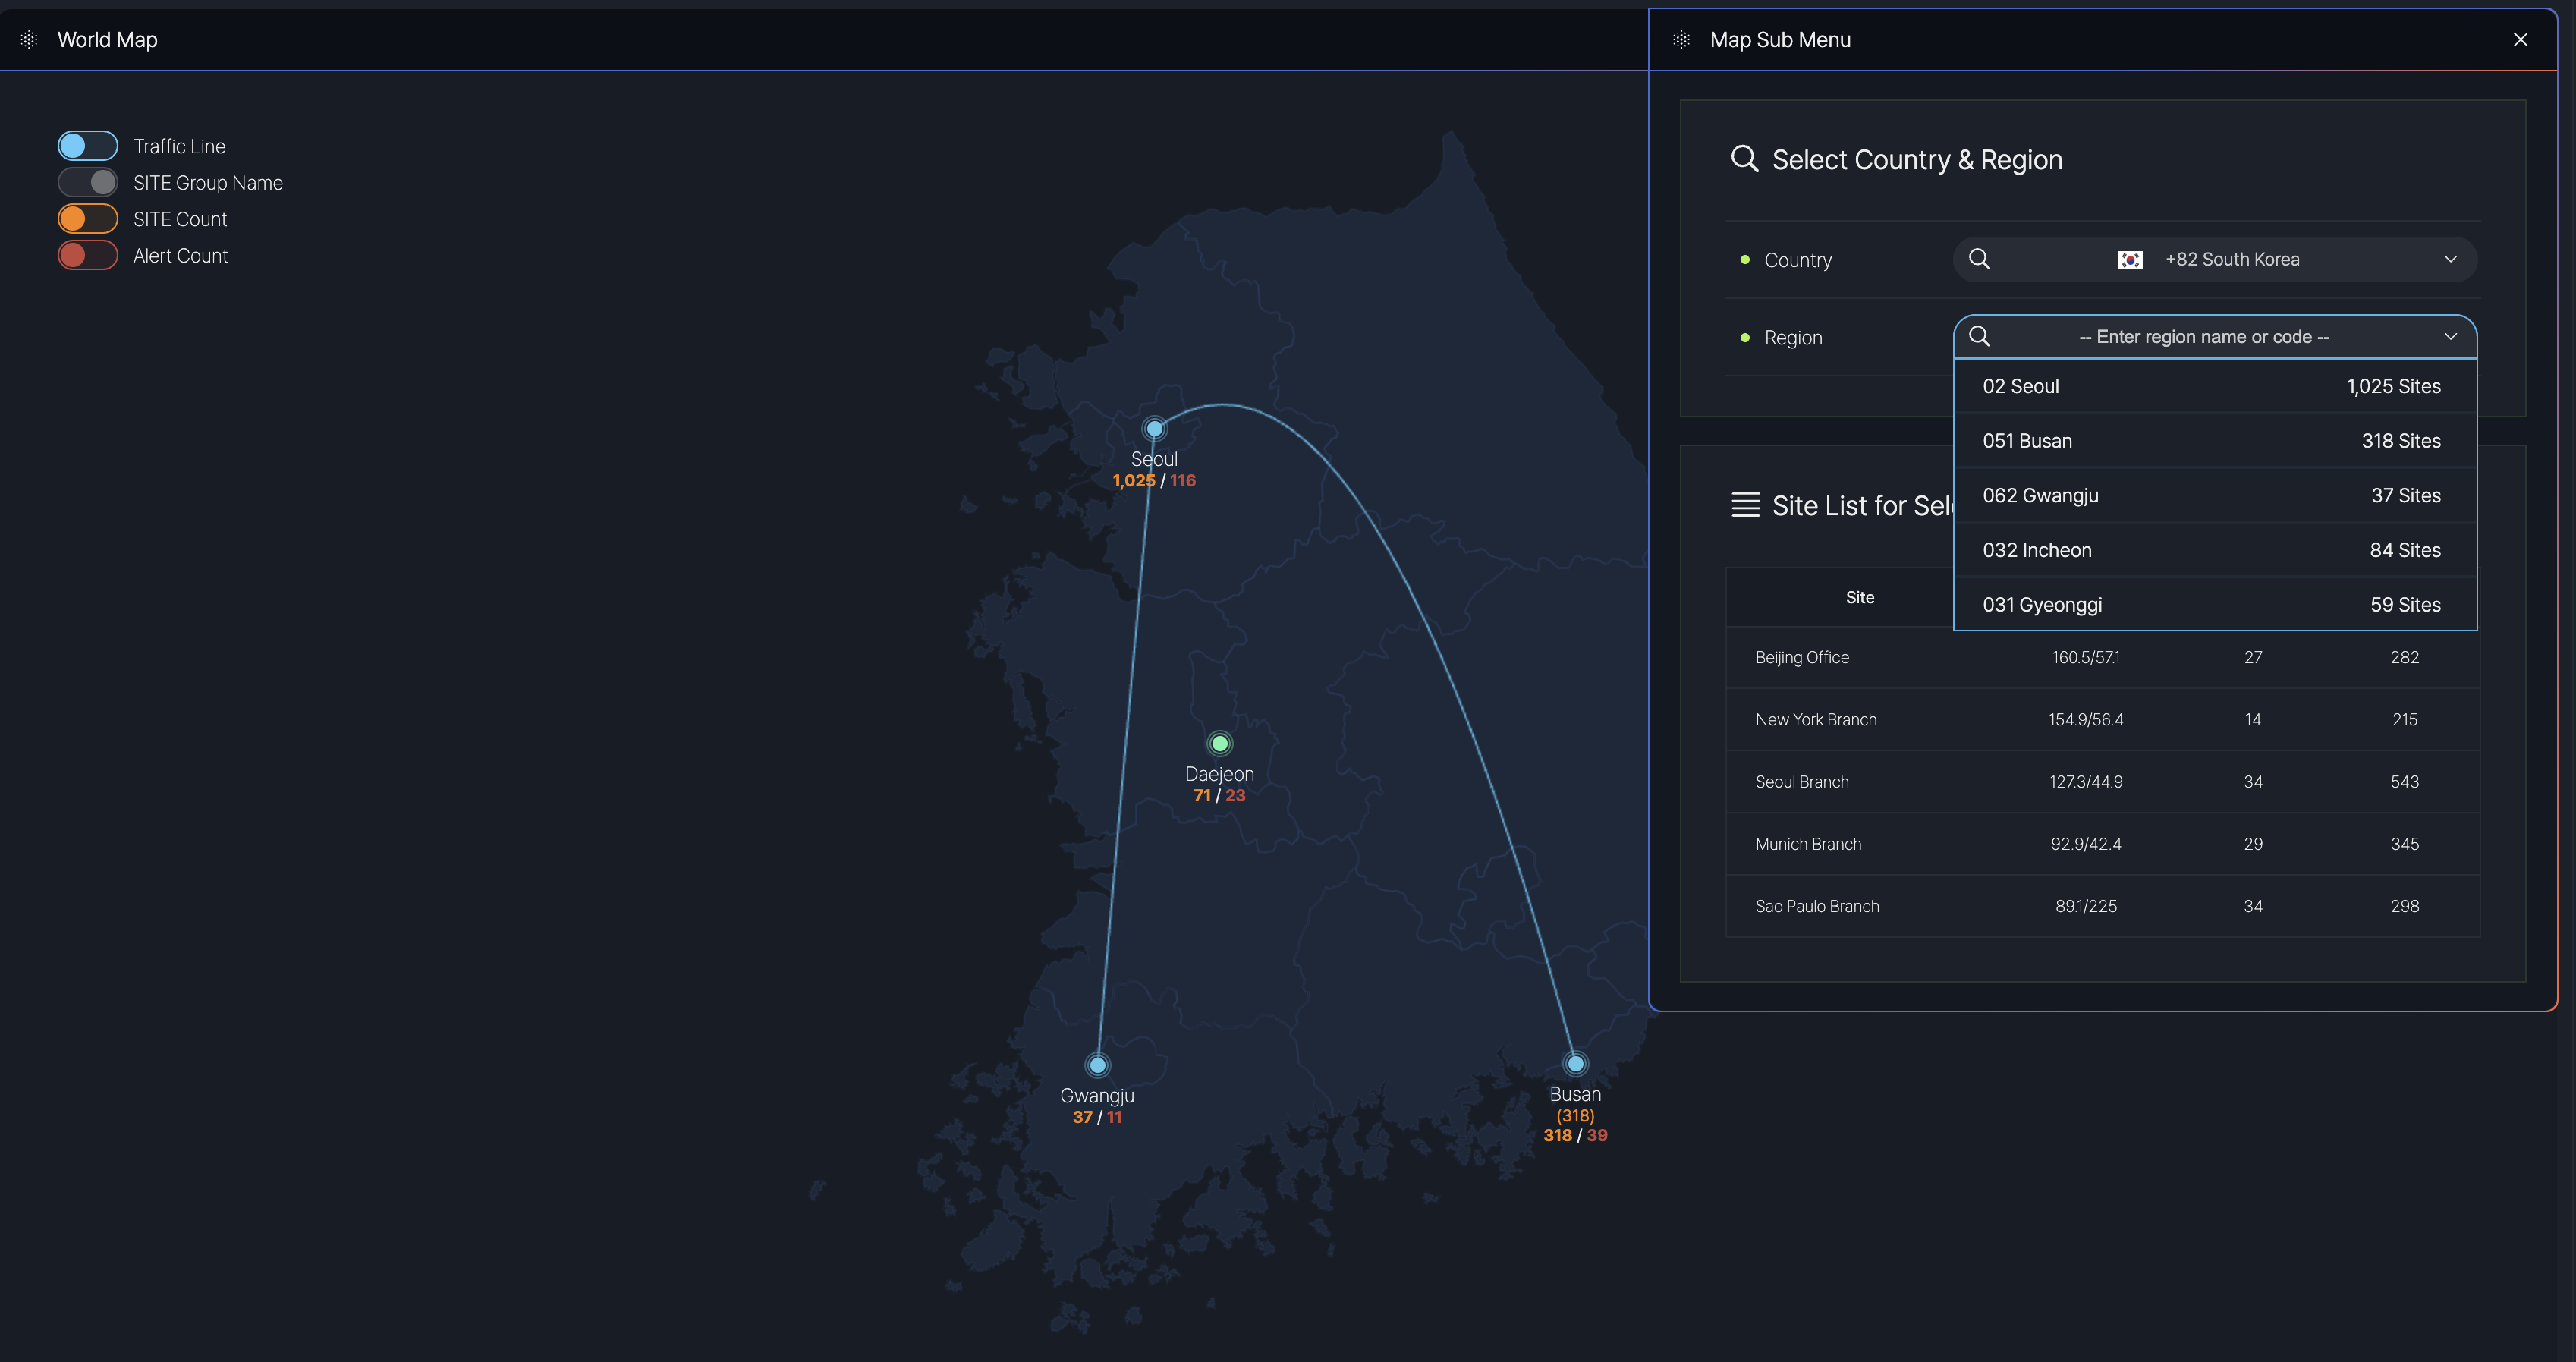
The image above shows the Map Sub Menu with the country filter set to South Korea and the region dropdown expanded, displaying available regions. The map and site list reflect the filtered view for South Korea, with detailed metrics for each site.
No Comments