Report
Event Report
The Event Report menu can be found in the Report section of the left sidebar.
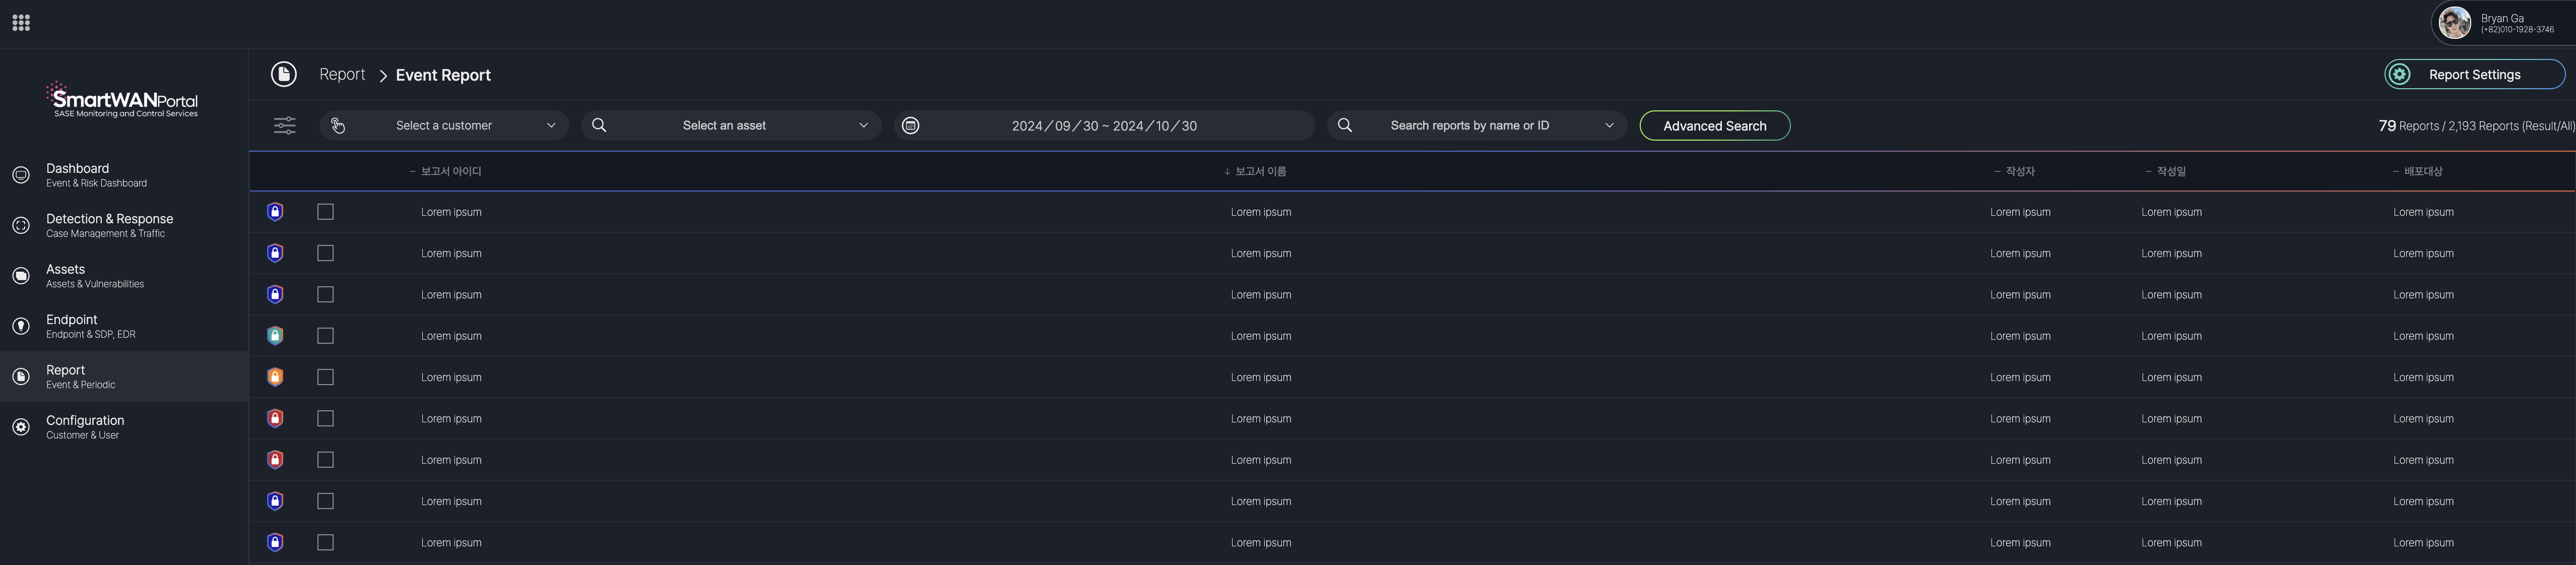
Event Report List
Event Report Details
Report Sections (Tabs) Table
| Tab Number | Section Name | Description |
|---|---|---|
| I | Overview | Provides a summary of the report, including title, ID, reporter, date, and analysis period. |
| II | Statistics | Displays statistical data related to the case, such as event counts and asset details. |
| III | Analysis | Details the analysis of the case, including root cause and impact assessment. |
| IV | Remediation | Outlines the remediation steps taken to resolve the incident. |
| V | Conclusion | Summarizes the outcomes and conclusions of the case response. |
| VI | Recommendations | Offers recommendations to prevent similar cases in the future. |
I. OverView
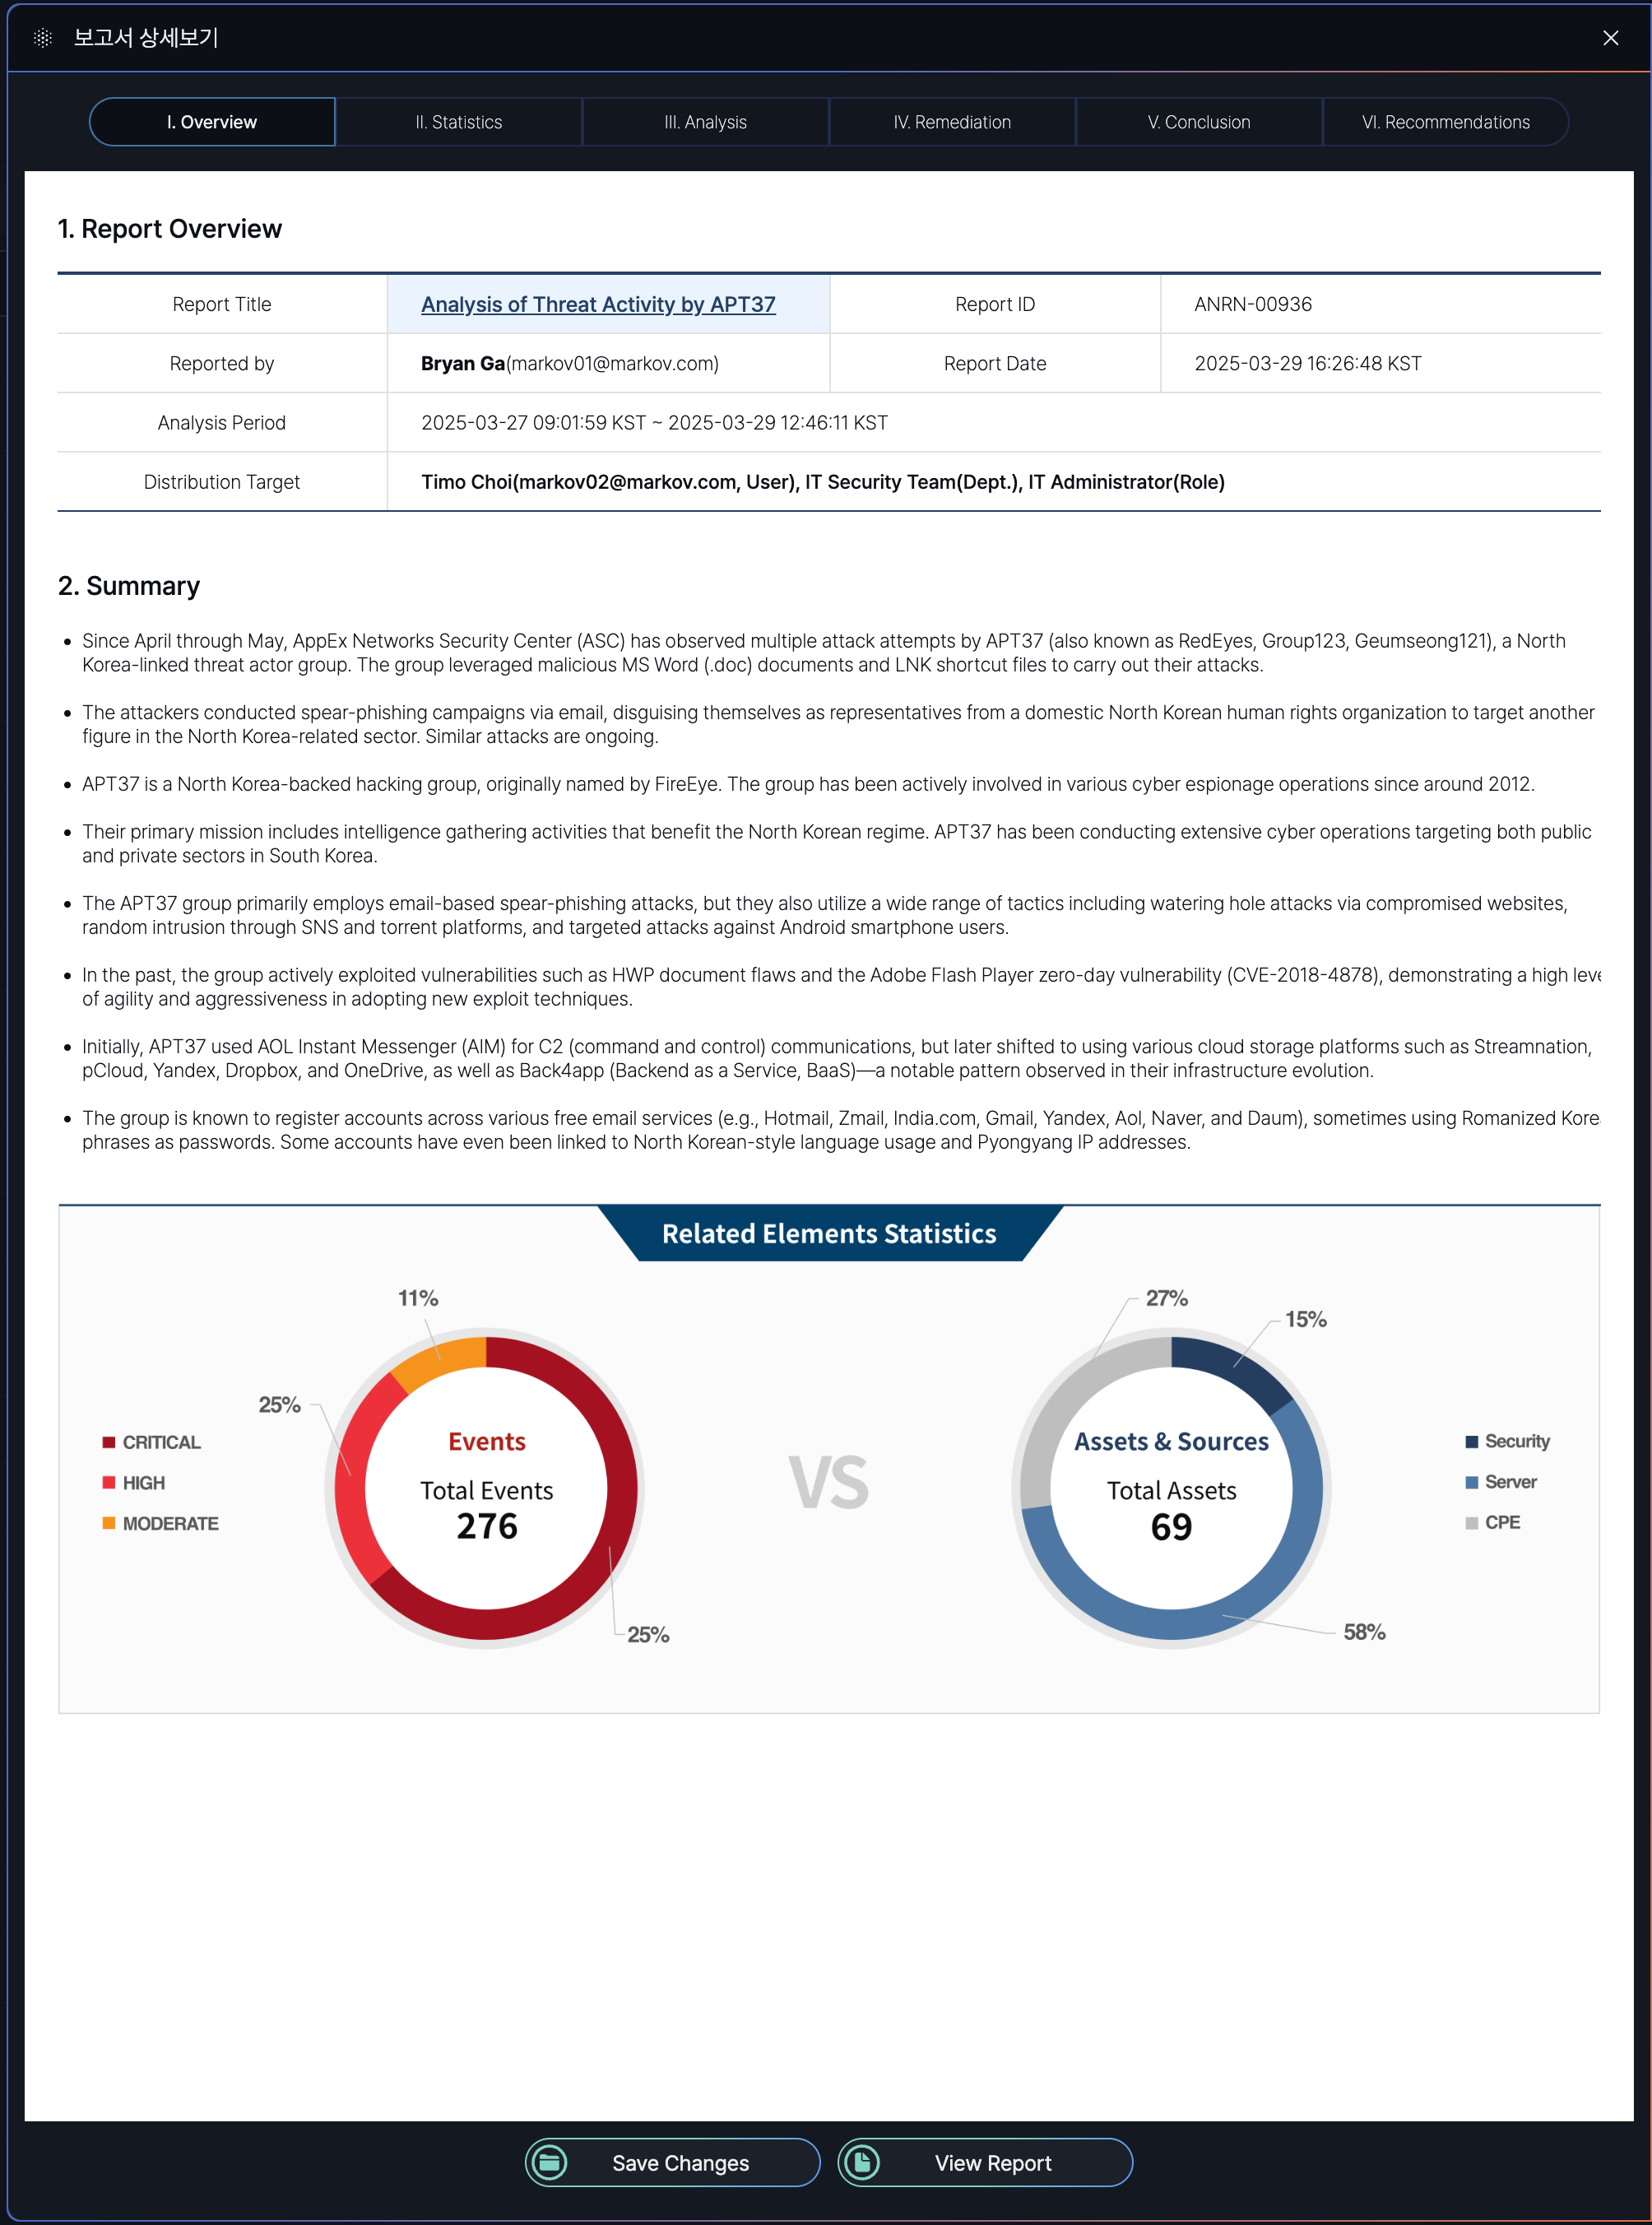
The Event Report Detail Screen under the "Overview" tab (I) includes the following items, each serving a specific purpose:
- Report Title: Indicates the main subject or focus of the report, providing a clear identifier for the incident or analysis.
- Report ID: A unique identifier assigned to the report for tracking and reference purposes within the system.
- Reported By: Identifies the user who generated the report, including their contact information for accountability and follow-up.
- Report Date: Specifies the date and time when the report was finalized, helping to establish a timeline for the incident response.
- Analysis Period: Defines the time range during which the incident was analyzed, providing context for the duration of the event and response efforts.
- Distribution Target: Lists the individuals, teams, or roles to whom the report is distributed, ensuring relevant stakeholders are informed.
- Summary: Offers a high-level overview of the incident, including key findings, the nature of the threat, and its impact, to provide a quick understanding of the situation.
- Related Elements: Presents statistical data in visual form (e.g., pie charts) to show the distribution of events by severity and the types of assets affected, aiding in understanding the scope and impact of the incident.
II. Statistics
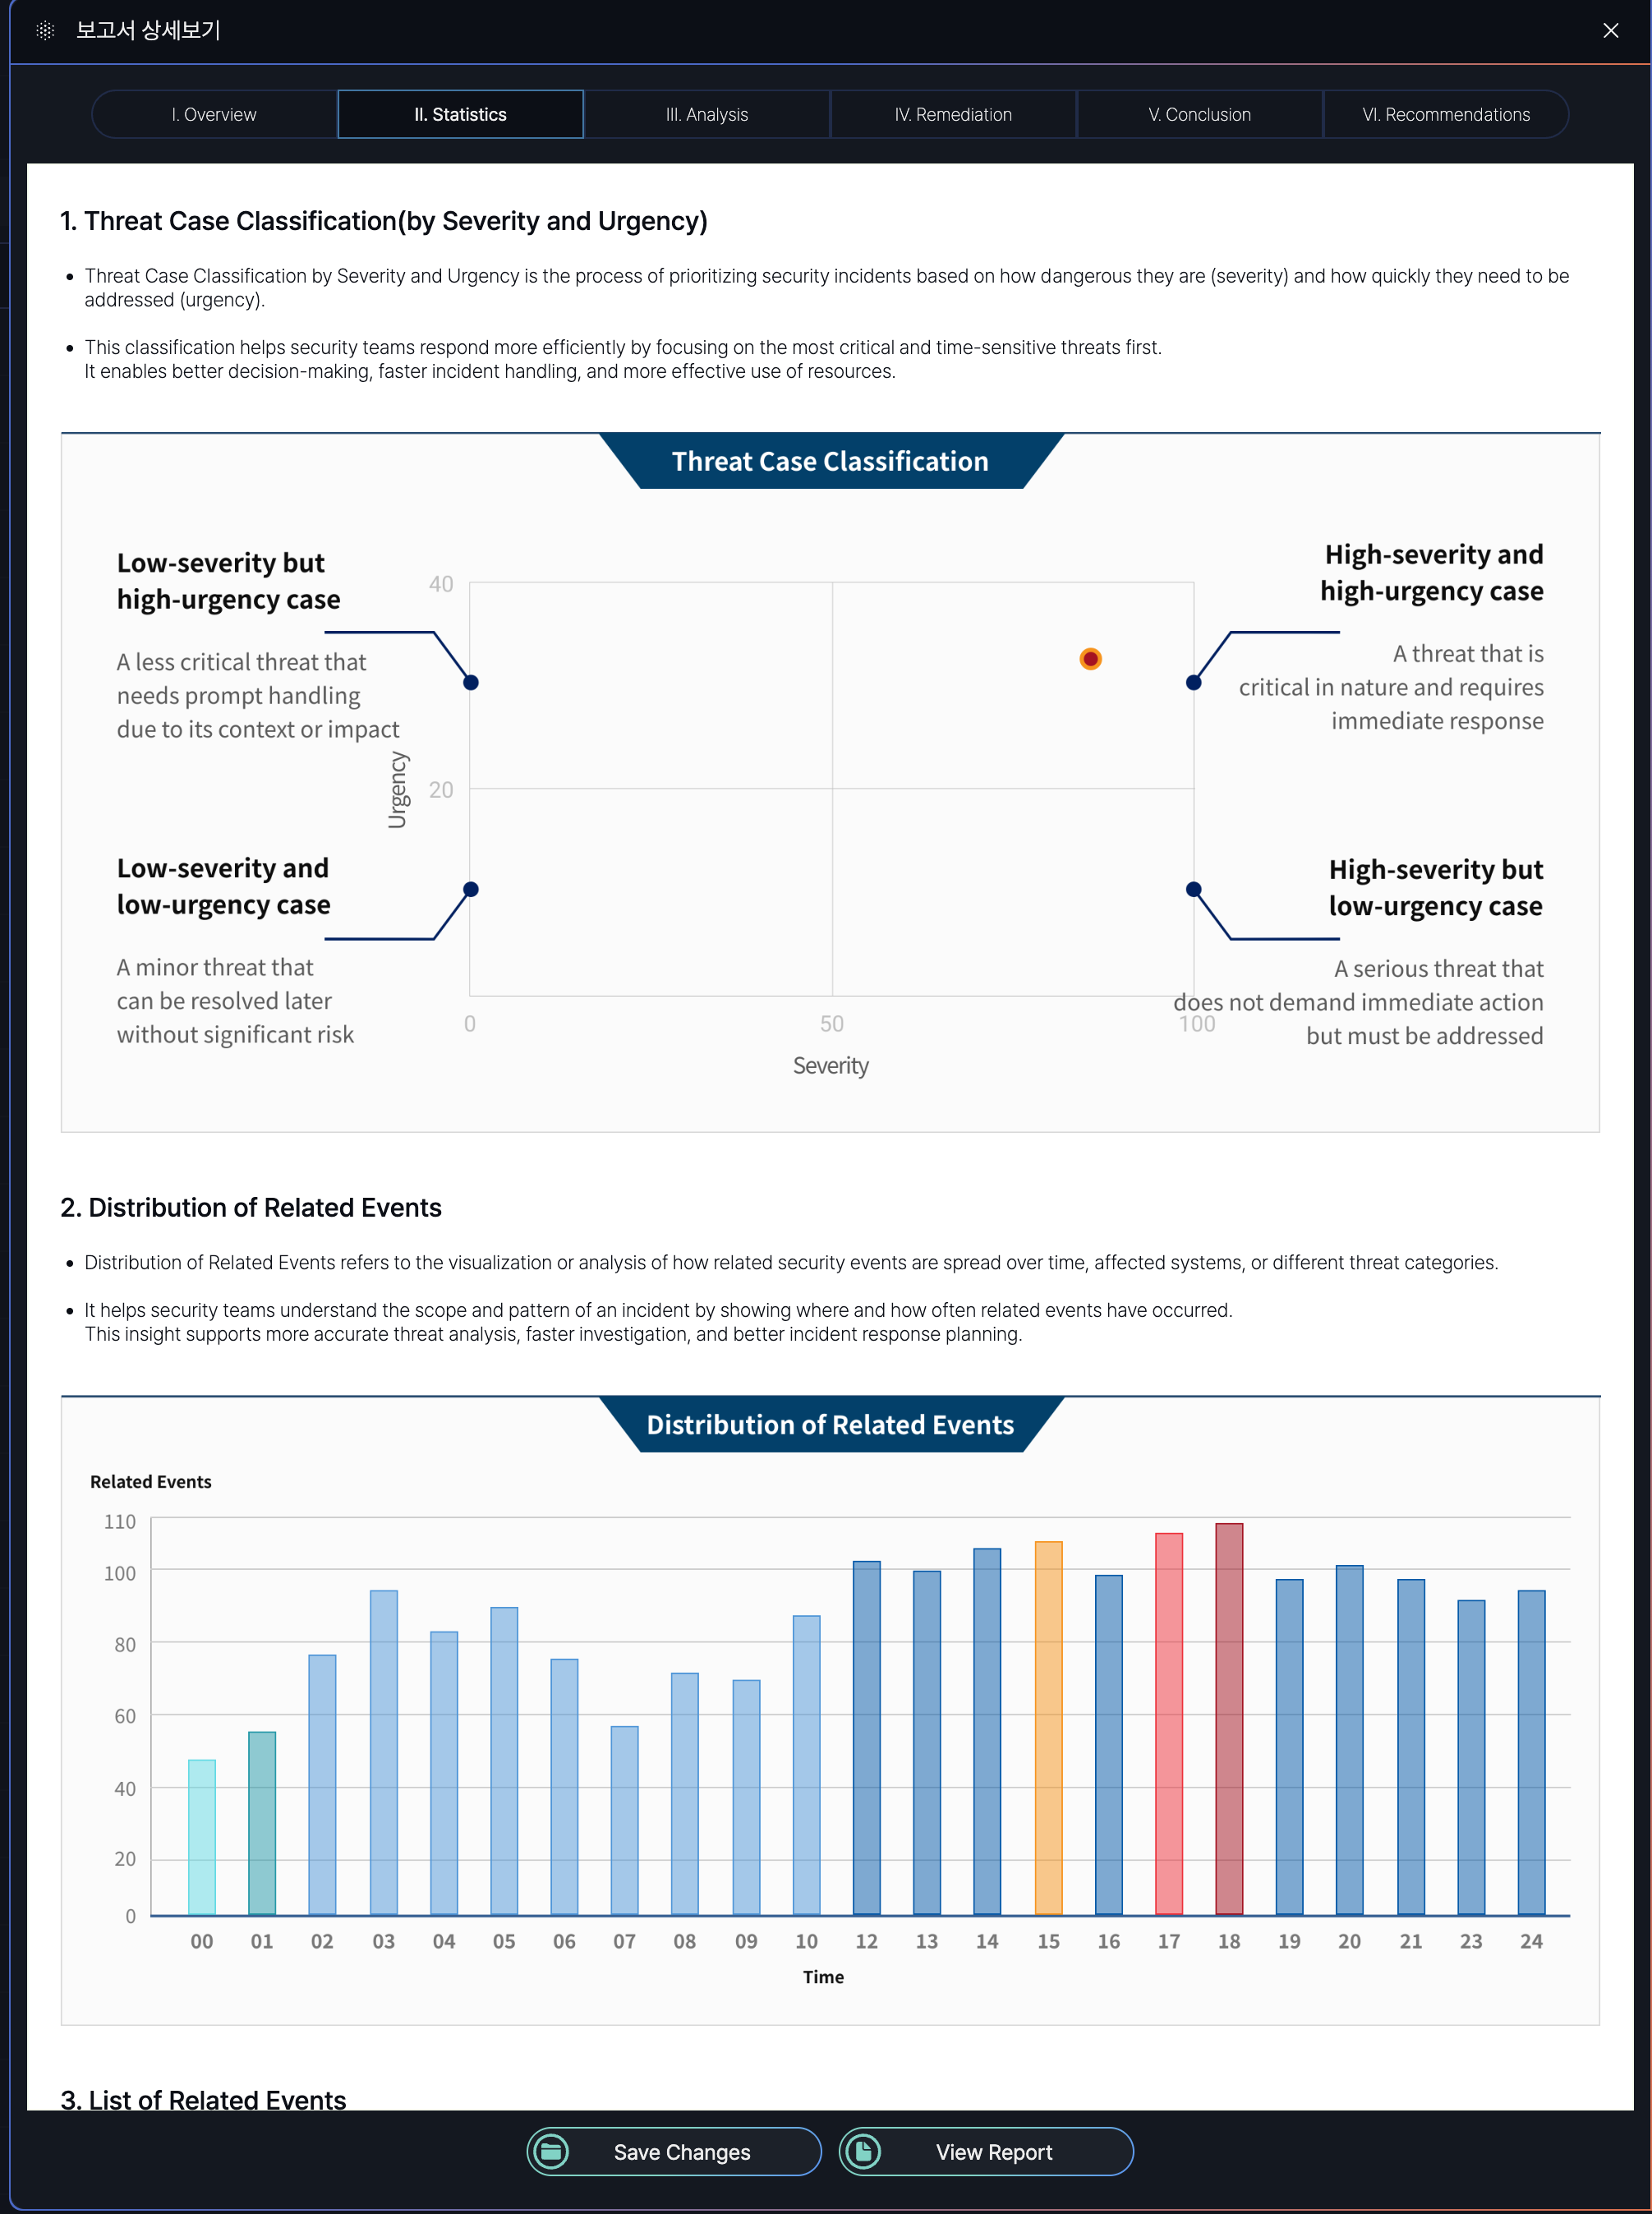
This image displays a partial section of the complete report.
Statistics Report Summary
| Section | Purpose | Key Details |
|---|---|---|
| Threat Case Classification | Prioritizes security cases based on severity and urgency. | - Severity: Measures threat danger (Low/High). - Urgency: Measures response time needed (Low/High). - Matrix: Combines both (e.g., High Severity + High Urgency = Critical). |
| Distribution of Related Events | Visualizes how related security events spread across time/systems. | - Tracks event frequency and patterns. - Aids in identifying attack scope and hotspots. |
| List of Related Events | Groups events with shared attributes to uncover attack sequences. | Grouping Criteria: - Common Indicators: Shared IPs, users, devices. - Time Correlation: Events in close proximity. - Attack Patterns: Matches MITRE ATT&CK tactics. - Behavior Analysis: Suspicious chains (e.g., file execution → external connection). - Threat Intelligence: Matches known IOCs. |
Threat Case Classification Matrix
| Severity \ Urgency | Low Urgency | High Urgency |
|---|---|---|
| Low Severity | Minor threat; resolve later. | Less critical but needs prompt handling. |
| High Severity | Serious threat; no immediate action. | Critical; requires immediate response. |
Key Takeaways
-
Prioritization: Clear severity/urgency tiers streamline incident response.
-
Pattern Analysis: Distribution and event grouping reveal attack trends.
-
Correlation: Multi-criteria linking (time, behavior, IOCs) enhances threat detection.
III. Analysis
The Analysis tab (III) in the Event Report Detail Screen of the SmartWAN Portal provides in-depth threat pattern analysis, response effectiveness, and correlations between threat factors.
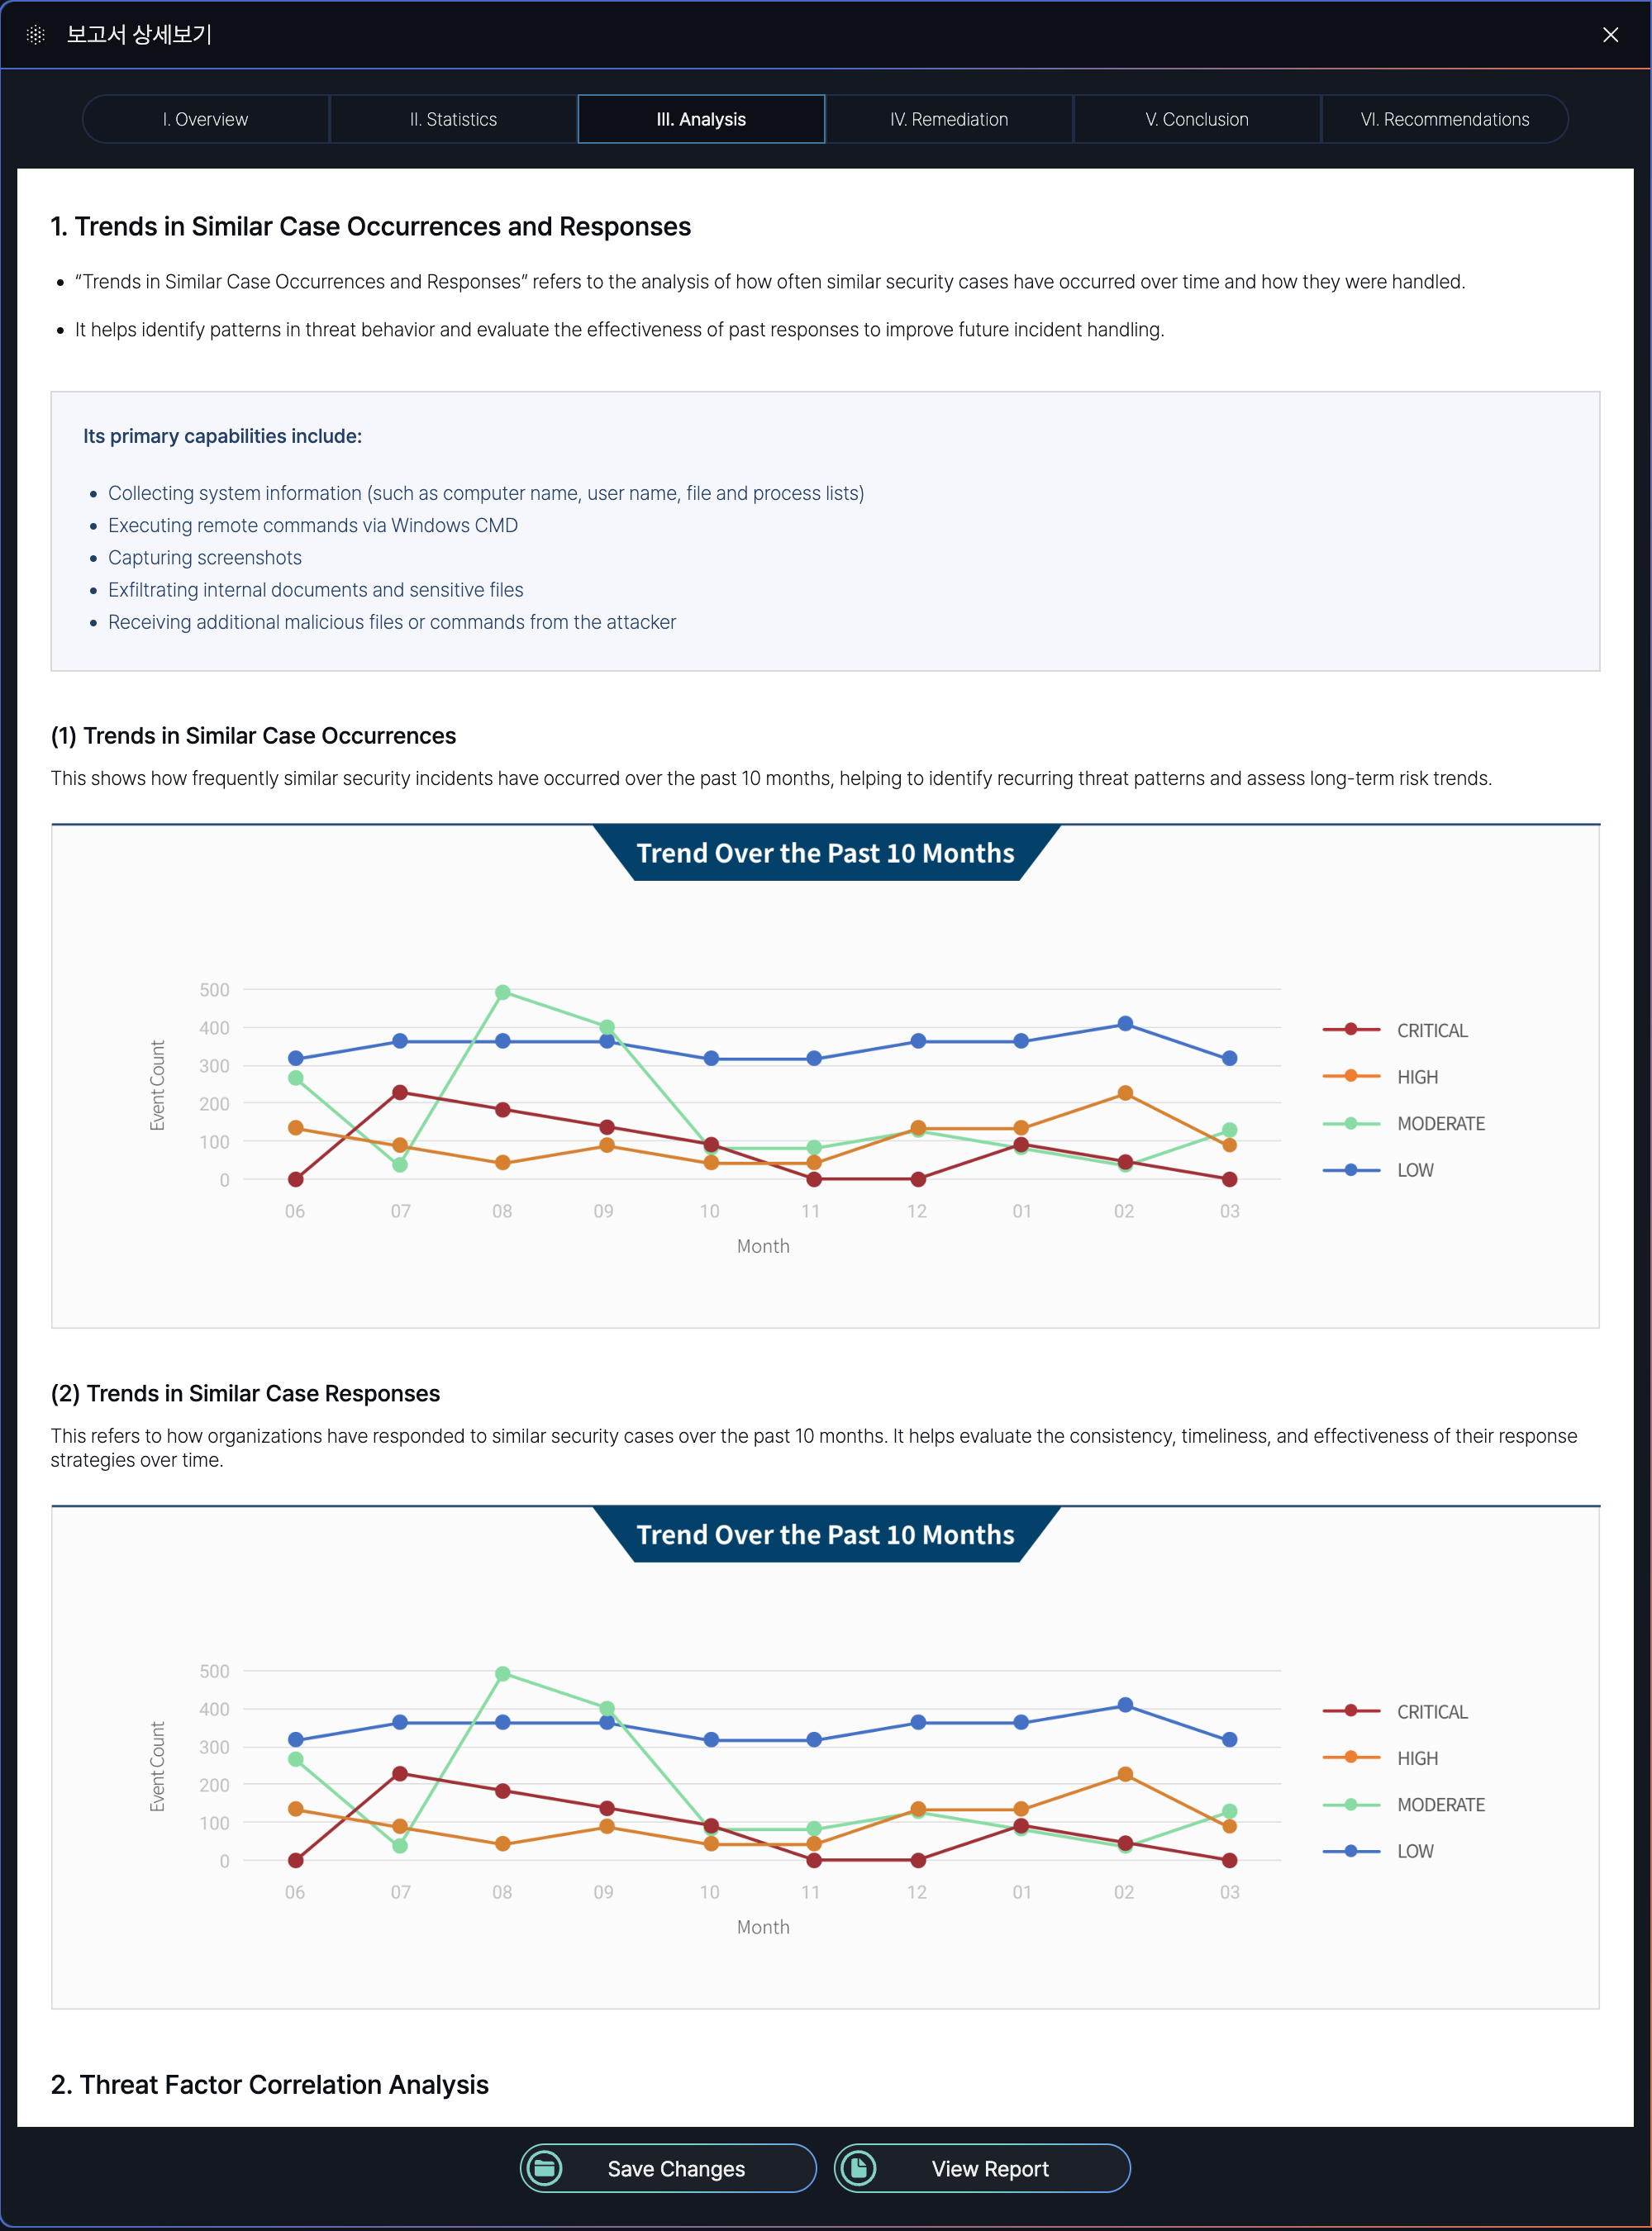
This image displays a partial section of the complete report.
Threat in Similar Case Occurrences and Responses
| Section | Purpose | Key Details |
|---|---|---|
| Threat in Similar Case Occurrences | Analyzes the frequency and severity of past security threats over a specified period. | - Tracks threat patterns (e.g., monthly trends). - Visualizes data to identify critical/high-risk periods. |
| Threat in Similar Case Responses | Evaluates the effectiveness of organizational responses to past threats. | - Assesses response strategies (e.g., speed, methods). - Identifies areas for improvement. |
Threat Factor Correlation Analysis
| Section | Purpose | Key Details |
|---|---|---|
| Threat Level Distribution of Related Factors | Maps the severity levels (Critical/High/Moderate/Low) of linked threat factors. | - Highlights high-risk elements (e.g., IPs, users). - Aids in prioritizing response actions. |
| Probability Distribution of Risk Levels | Quantifies the likelihood of each risk level occurring among correlated factors. | - Uses statistical analysis (e.g., "60% Moderate risk"). - Supports predictive threat assessment. |
Correlation Rules: Time-based or entity-based logic is applied to detect complex attack patterns.
Threat Scores: Calculated based on severity, context, and threat intelligence to guide decision-making.
IV. Remediation
Remediation tab (IV) in the Event Report Detail Screen of the SmartWAN Portal provides threat mitigation actions, including detection, containment, recovery, and preventive measures for resolved security cases.
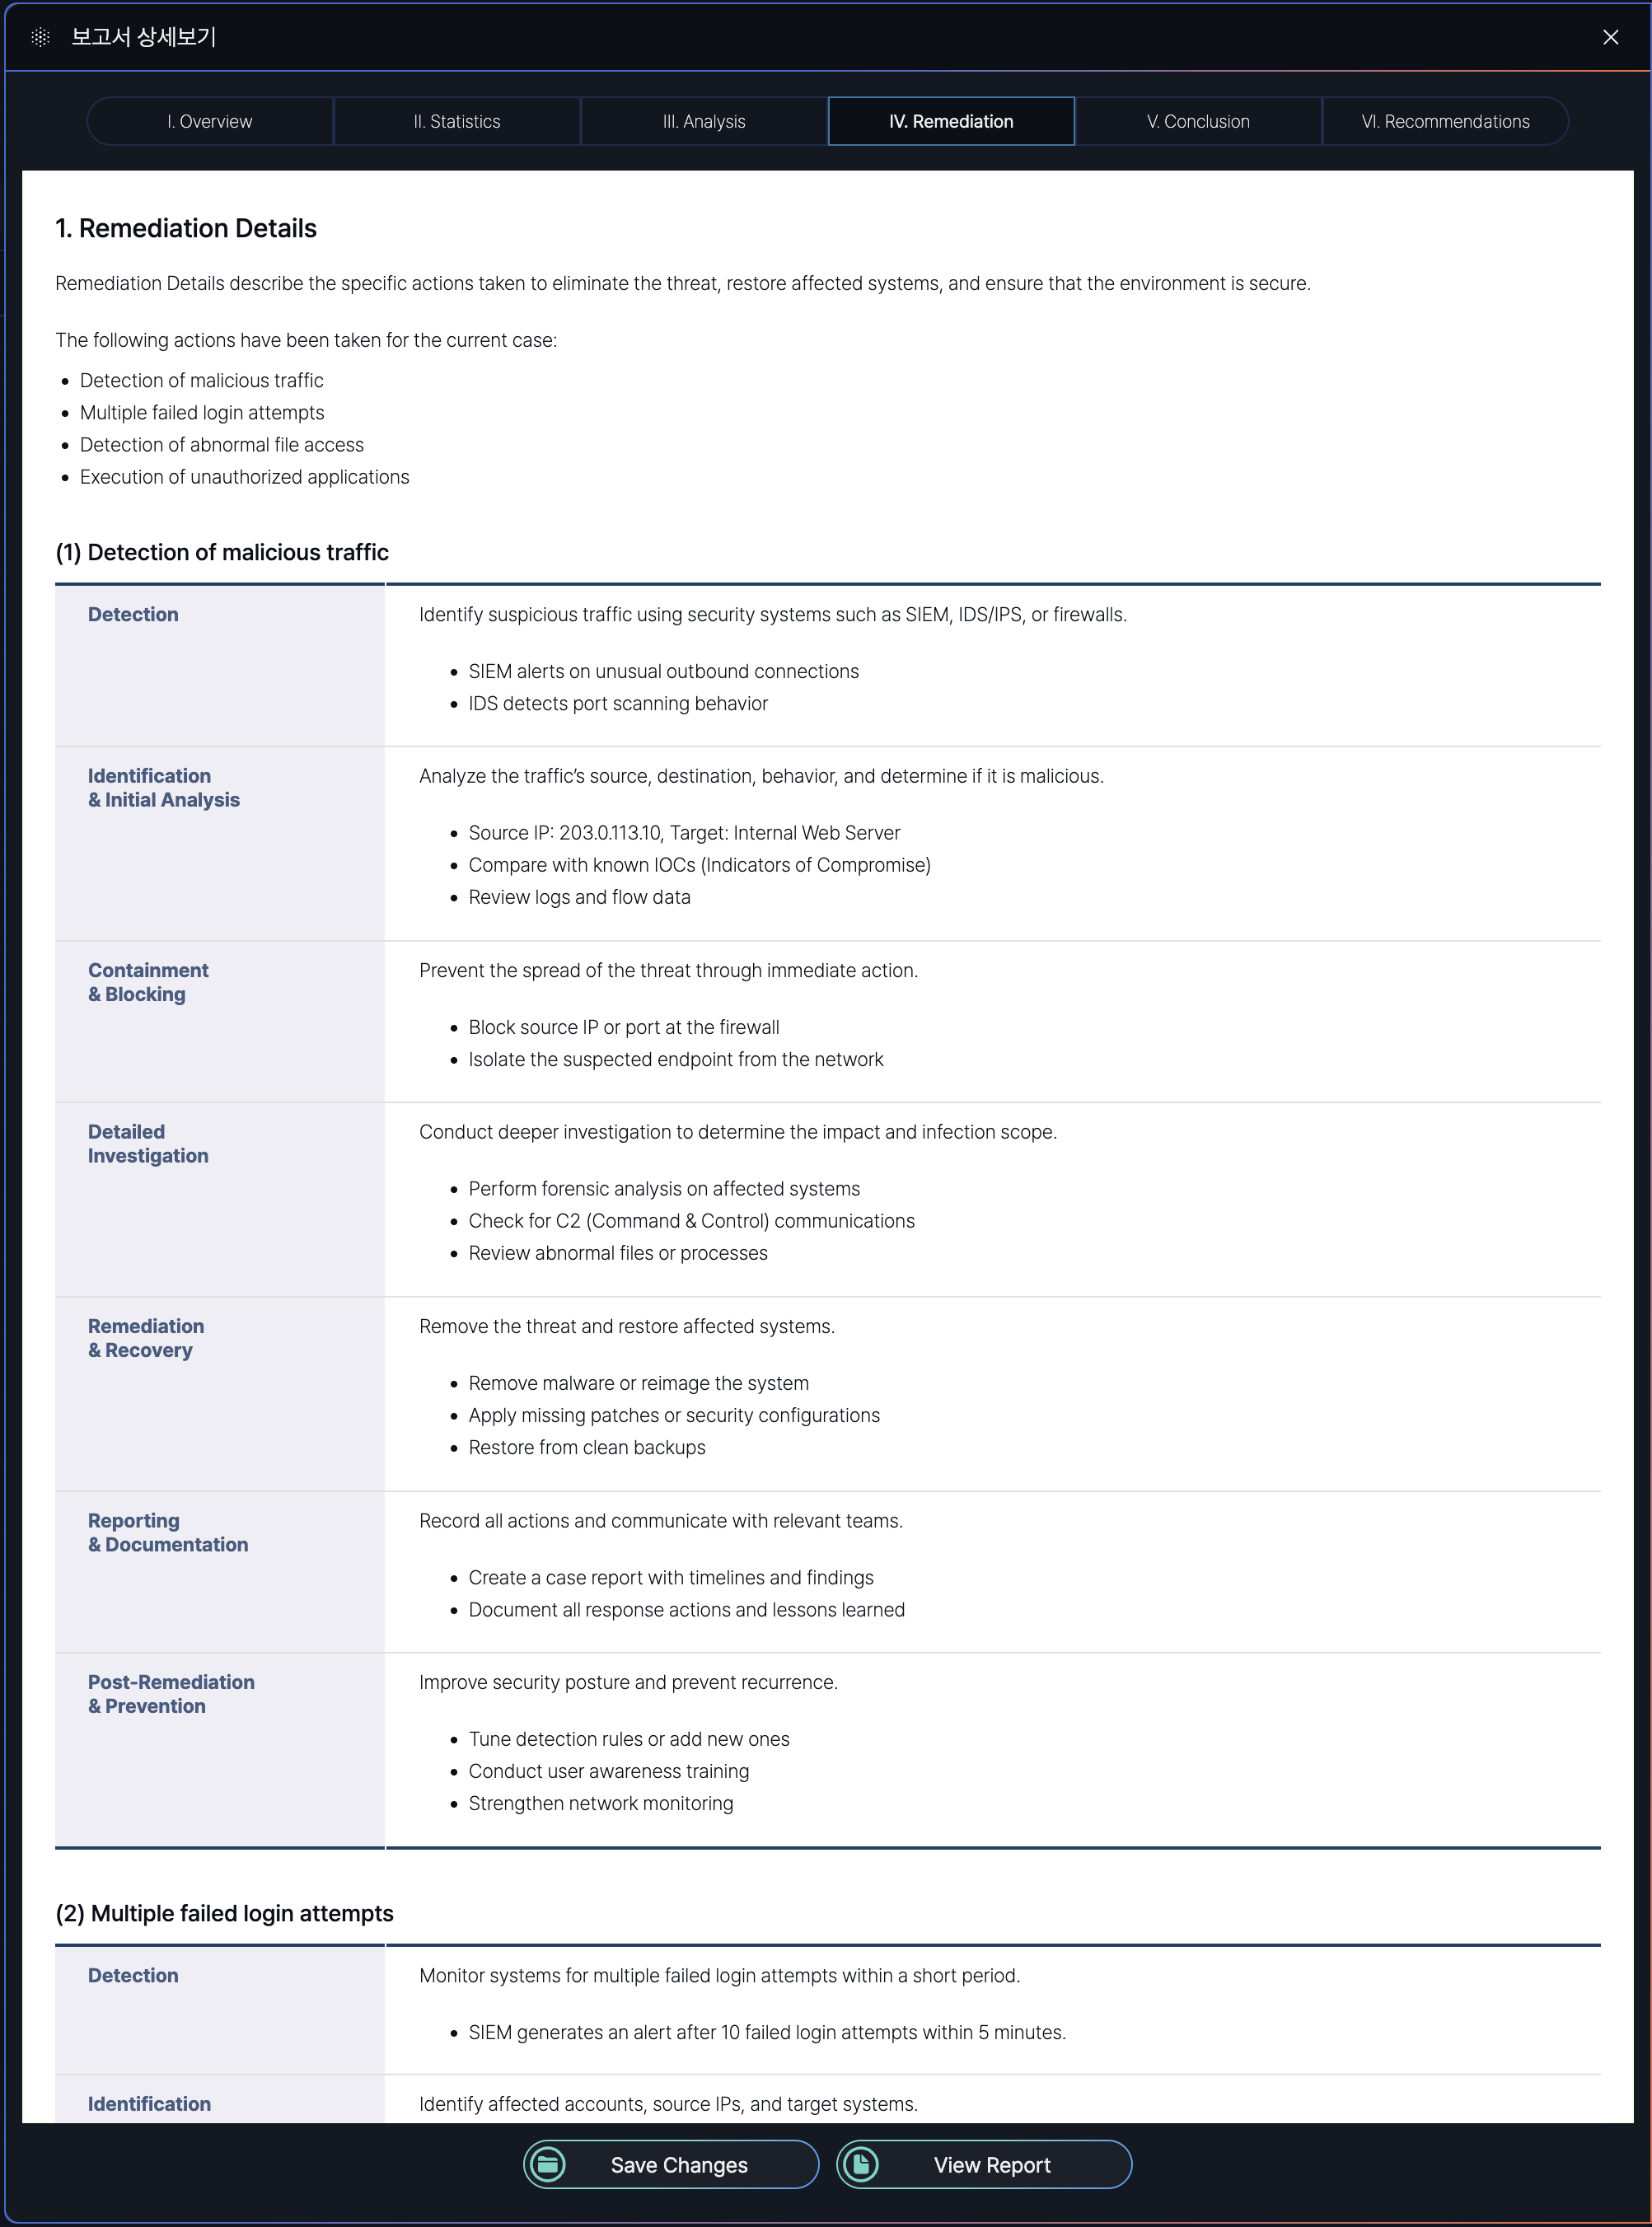
Remediation Report Section
| Section | Purpose | Explanation |
|---|---|---|
| Detection of Malicious Traffic | Identify and analyze suspicious network activities | Uses SIEM/IDS to detect anomalies like port scanning or unusual connections. |
| Multiple Failed Login Attempts | Prevent brute-force attacks and unauthorized access | Monitors repeated login failures, locks accounts, blocks suspicious IPs, and enforces stronger authentication (e.g., MFA). |
| Detection of Abnormal File Access | Protect sensitive data from unauthorized access or exfiltration | Alerts on unusual file access patterns (e.g., mass downloads). Includes user verification and role-based access reviews. |
| Execution of Unauthorized Applications | Block potentially harmful software execution | Detects unapproved apps (e.g., TeamViewer), terminates processes, and enforces app control policies (e.g., allowlisting). |
V. Conclusion
The Conclusion tab (V) in the Event Report Detail Screen of the SmartWAN Portal provides a synthesis of key findings about cases and indicators of attack.
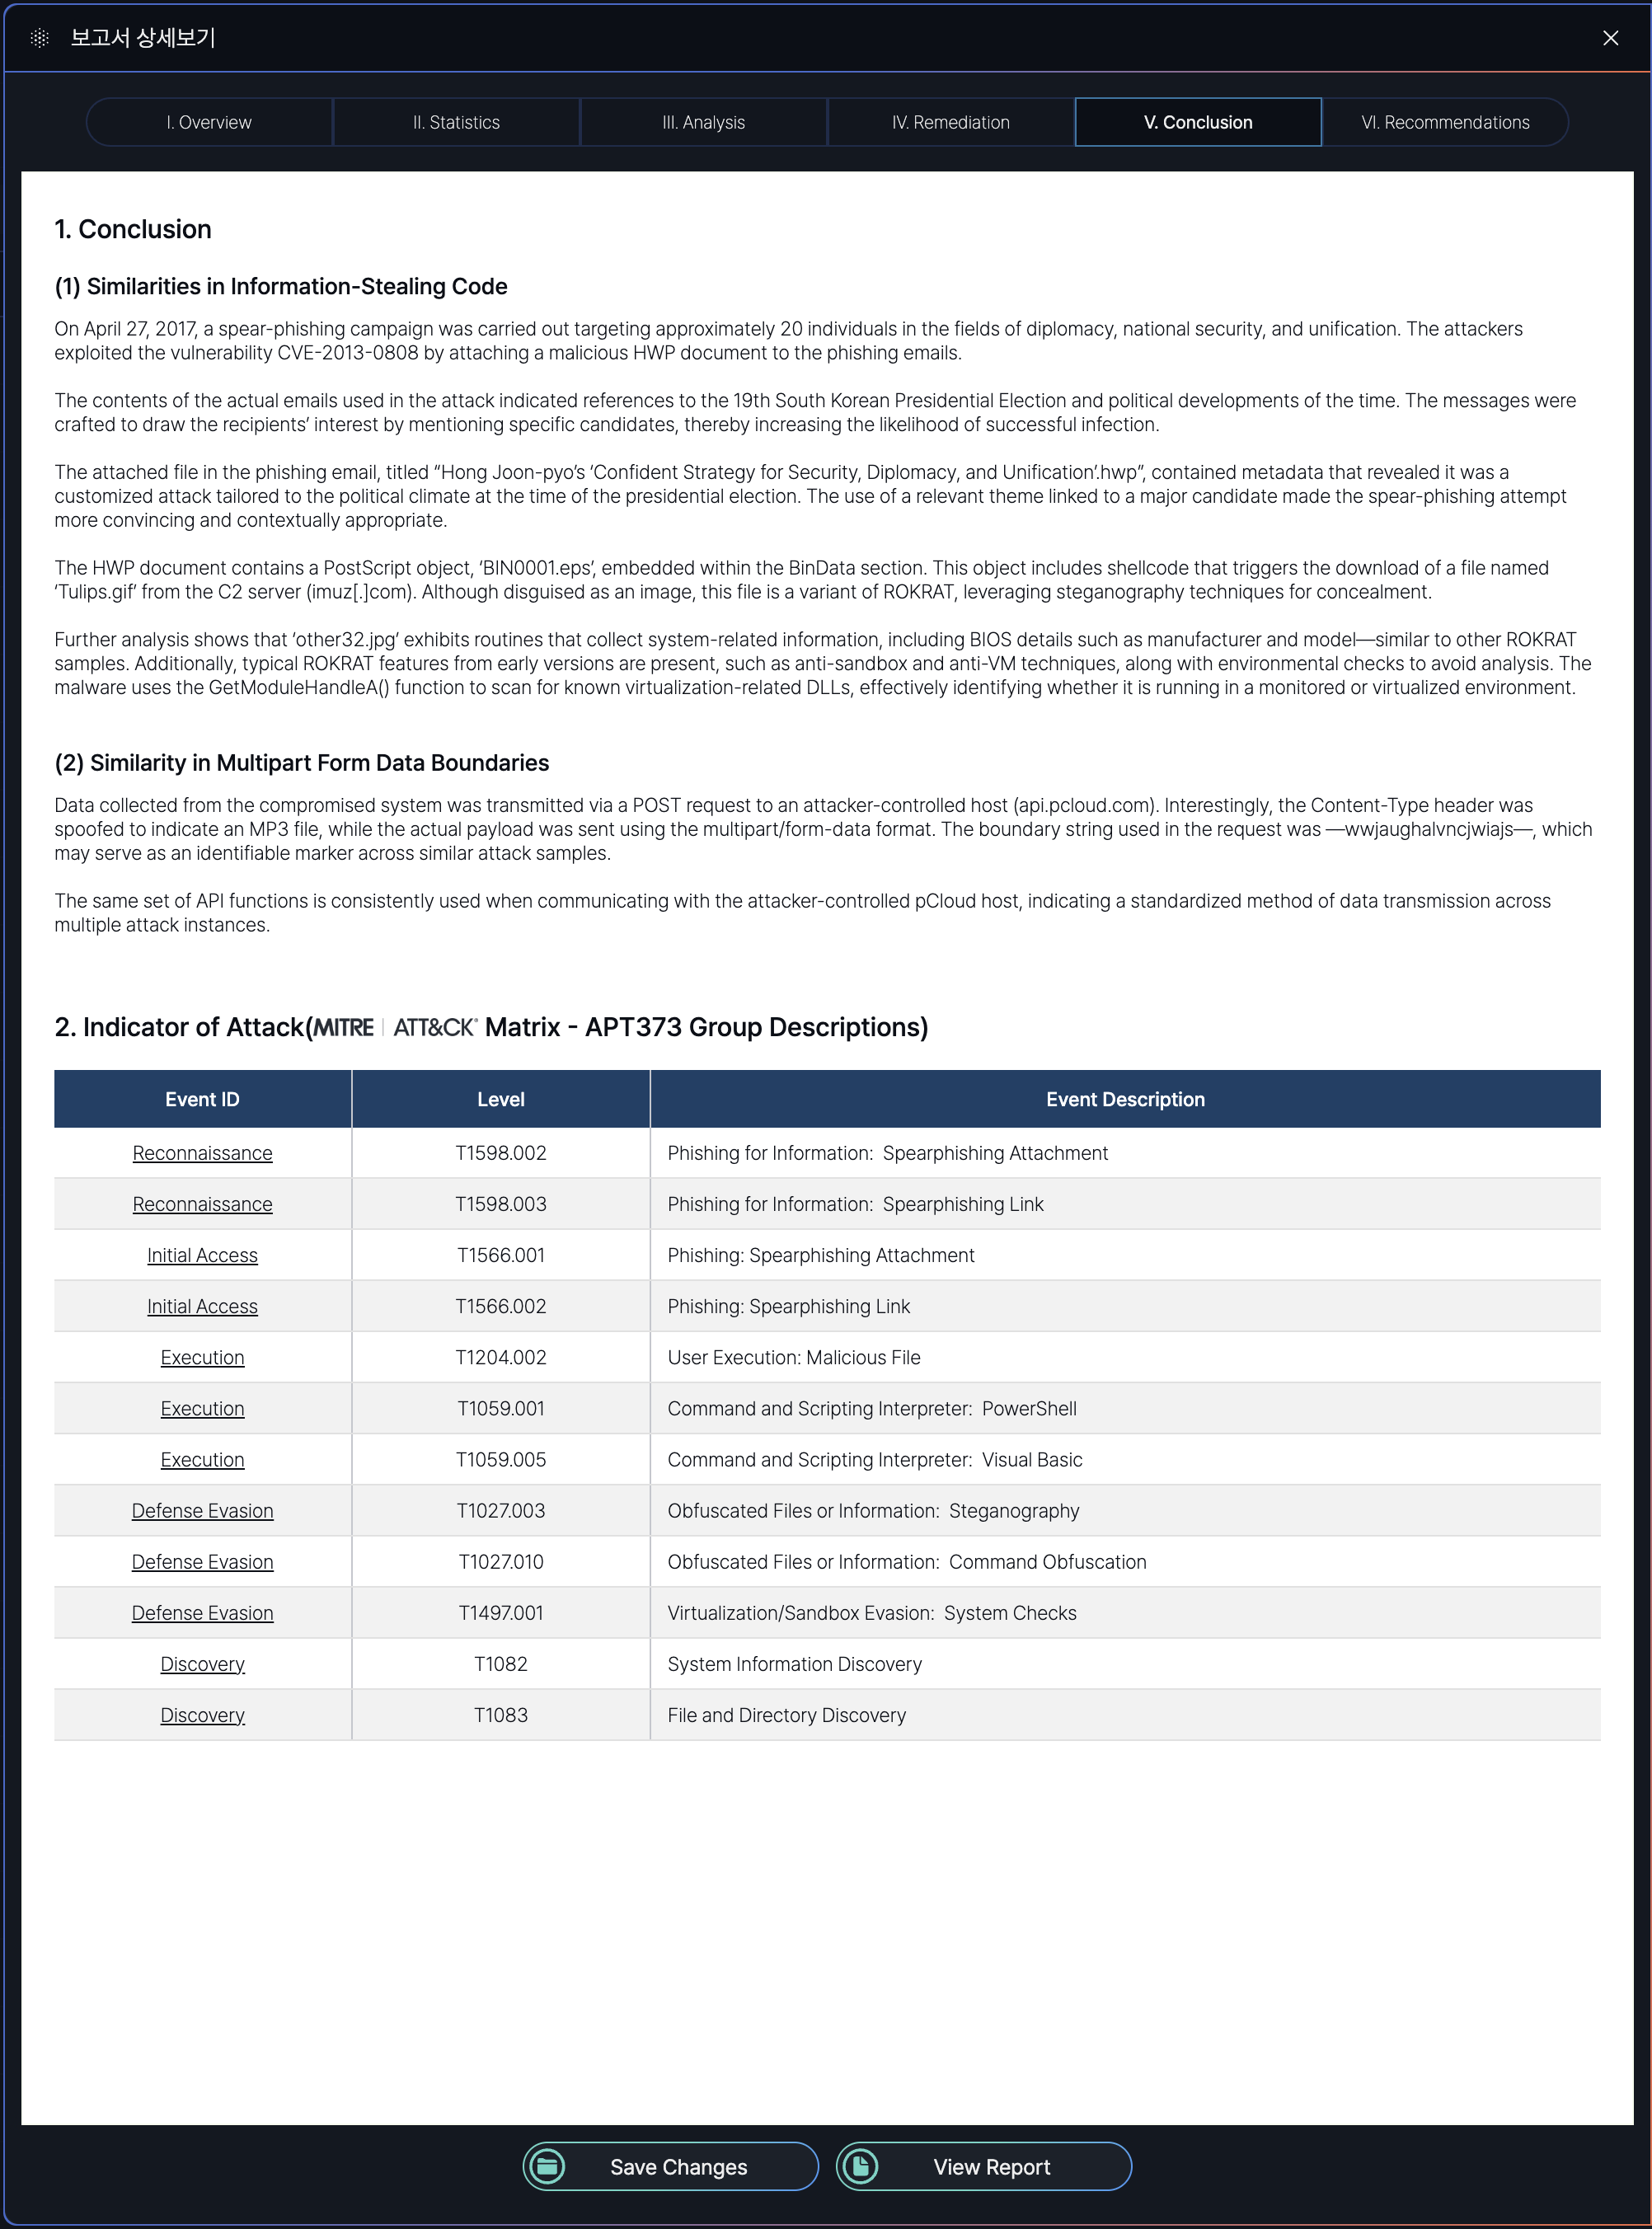
Section Overview
| Section | Purpose | Explanation |
|---|---|---|
| Conclusion | To synthesize key findings about cases. | Provides a high-level analysis of similarities in attack methods (e.g., code reuse, C2 communication) to link incidents to known threat actors or campaigns. Helps analysts identify operational patterns. |
| Indicator of Attack | To map observed tactics to standardized frameworks for threat categorization and response planning. | Aligns attack techniques (e.g., spearphishing, steganography) with MITRE ATT&CK tactics (e.g., T1566.001). Enables defenders to prioritize mitigations based on proven threat models. |
VI. Recommendations
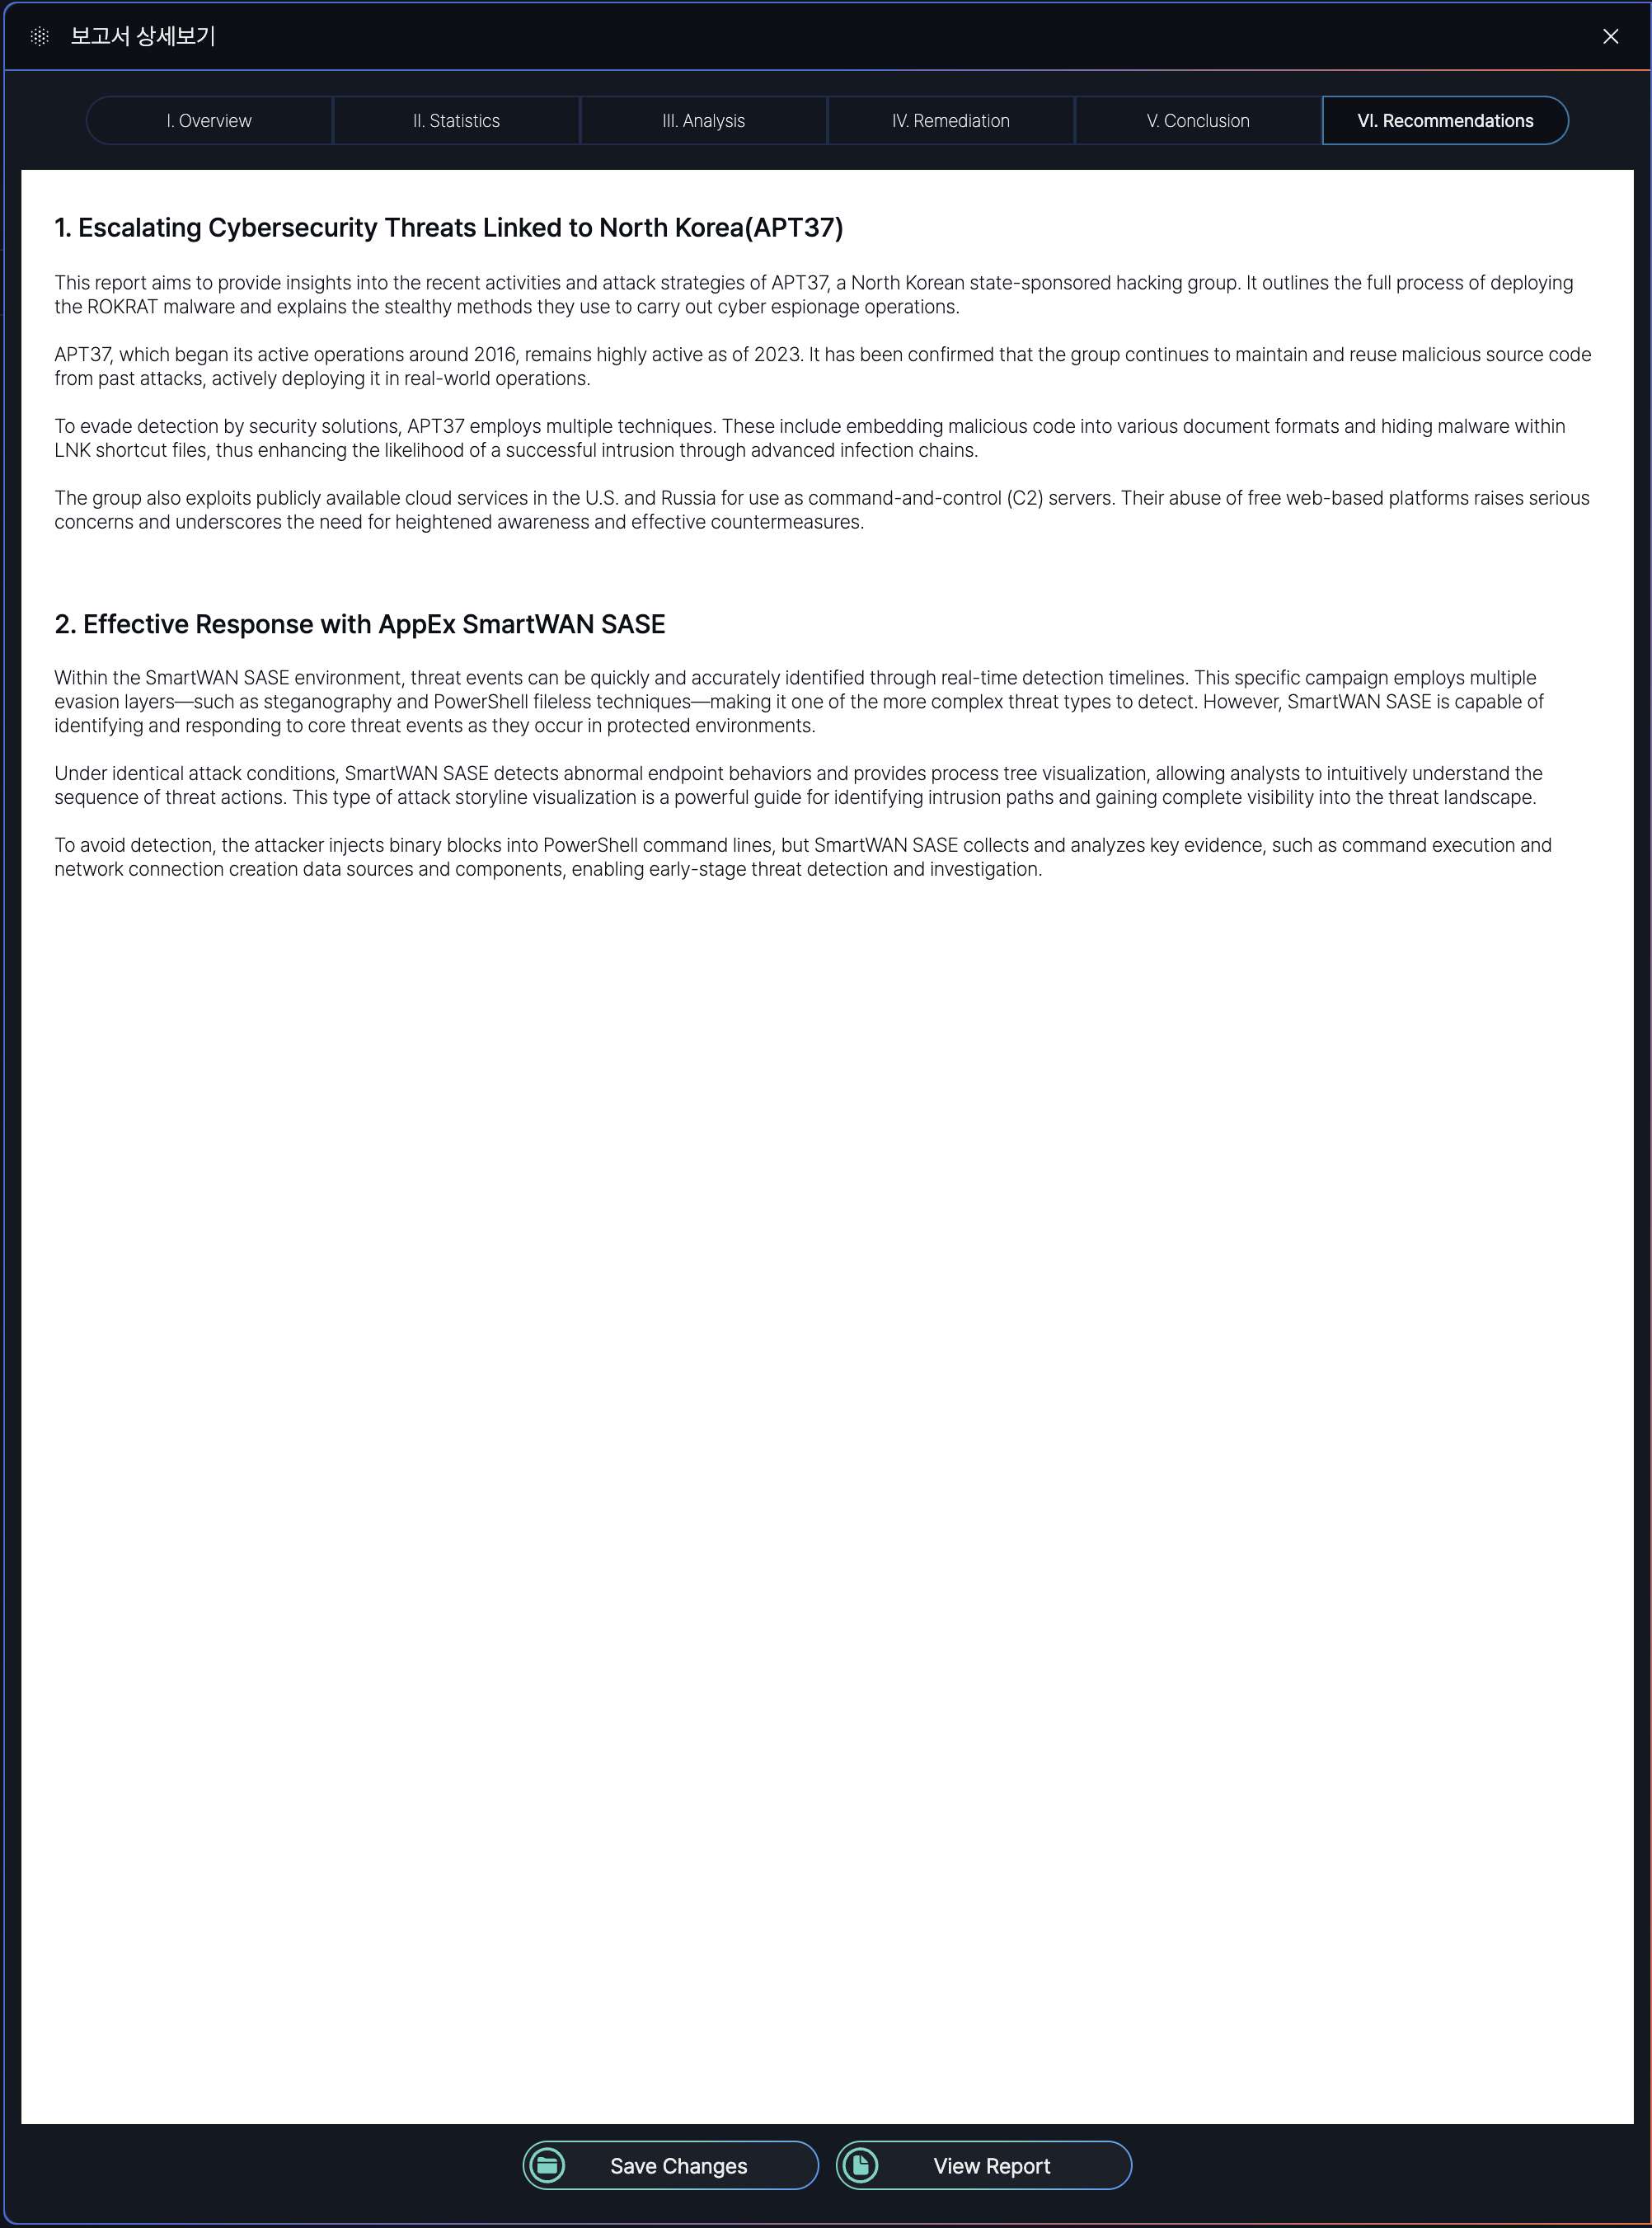
A sample PDF file of the Event Report described in this guide is available for download. You can access the full report, including all sections (Overview, Statistics, Analysis, Remediation, Conclusion, and Recommendations).
Sample PDF download: ANRN-00936.pdf (APPEX Networks user only)
No Comments